
EU Job Architecture in Minutes, Not Months: Introducing our Job Profile Library

SkillsTrust

• 4 minute read

This week we launched our Job Profile Library, currently in beta. It includes 100+ expert pre-scored job profiles, built on the EU point-factor method. Instead of scoring every job from scratch, employers can put together a first version of their job architecture in minutes, not months and then customise it for their business. We’d love for you to try it out and let us know what you think.

Here's why we built it.

In a past blog, we shared our analysis of the European Institute for Gender Equality (EIGE) guidelines for job evaluation.

The bottom-line is that these guidelines, which were published in March 2026, are a good thing for EU employers. They provide much-needed clarity on building compliant job architecture for EU Pay Transparency, and they offer an open-source alternative to the expensive proprietary job evaluation methodologies offered by incumbent providers. 

The Guidelines Are Useful but Implementing them Manually Is Painful.

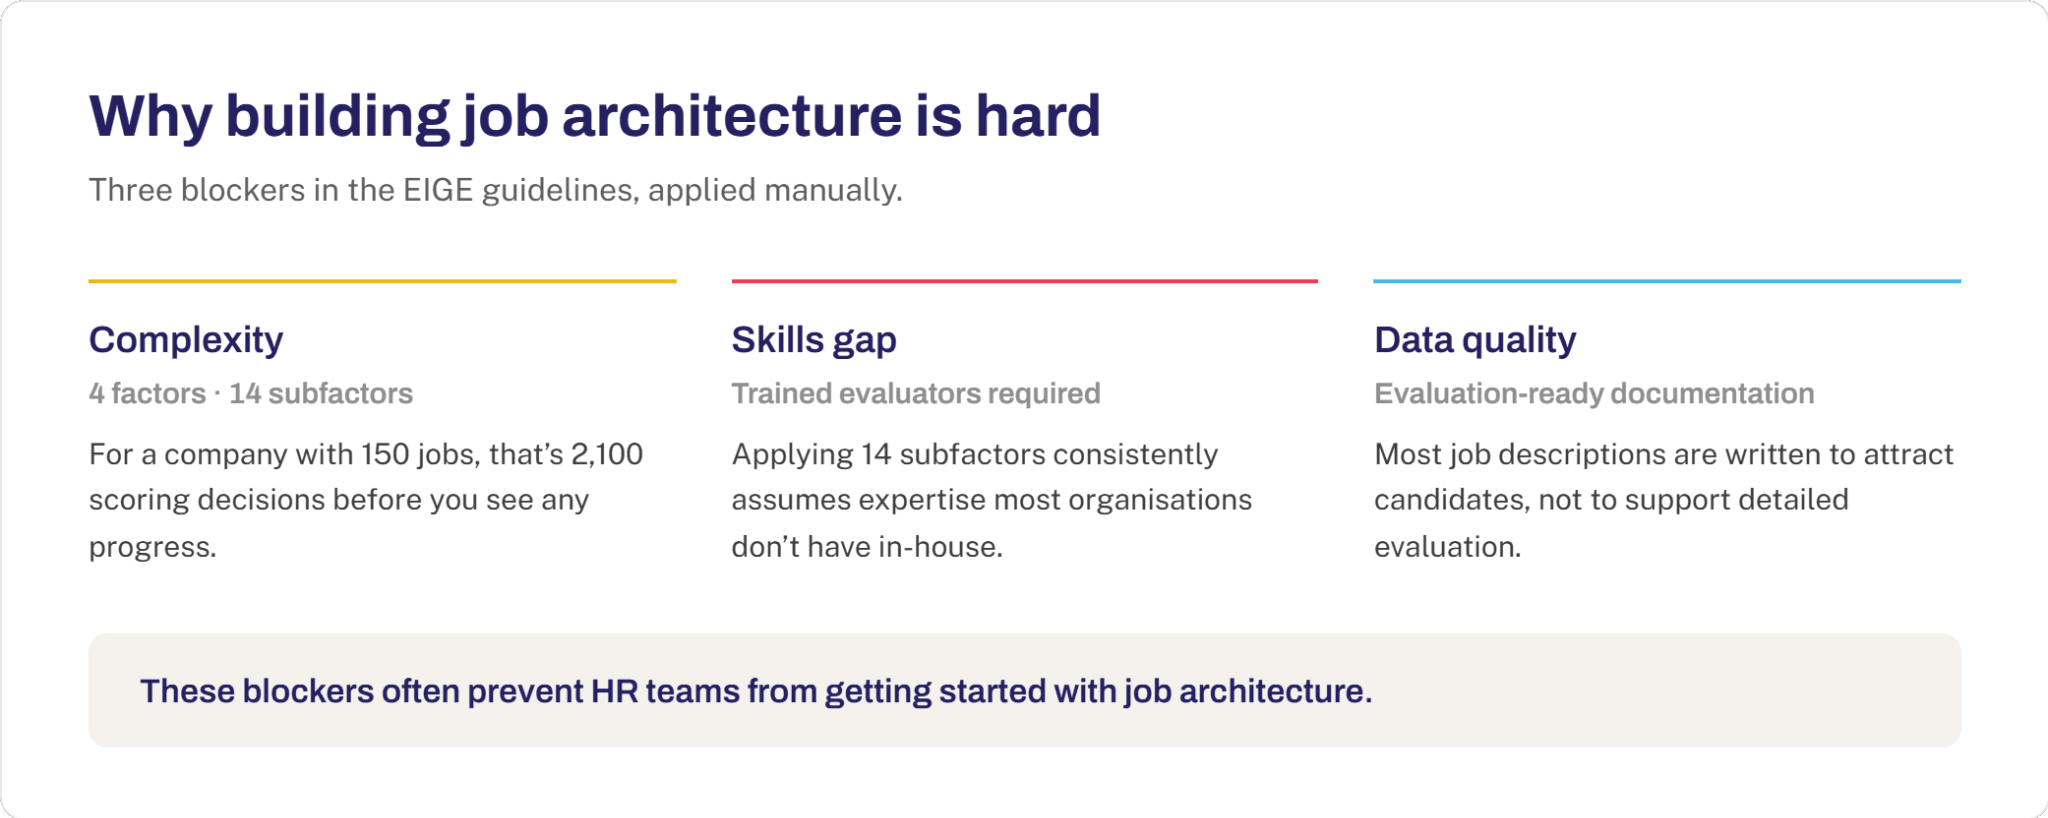
However, the guidelines let employers down in several ways. The level of effort, complexity, and pre-existing documentation required to implement these guidelines manually is unrealistic for most companies. The three biggest blockers we see across companies managing this work are:

  • Complexity. Scoring a job across 4 factors and 14 subfactors is a project in itself. A company with 150 jobs, scoring each across 14 subfactors will need to make 2,100 scoring decisions.

  • Skills gap. Applying those 14 subfactors consistently assumes trained job evaluators, which most organisations don't have in-house. 

  • Data quality. Scoring assumes detailed, standardised job documentation is available. Most job descriptions are written to attract candidates, not to support this kind of detailed evaluation exercise.
That implementation barrier is a problem, and the EIGE guide does not have a lot of answers that don’t involve endless back and forth with multiple stakeholders. 

EU pay transparency has the potential to close the gender pay gap but only if it's easy for employers to implement. Our mission at SkillsTrust is to make pay transparency as simple, fast, and affordable as possible. In the past, the issues above have stood in the way.  

How the Job Profile Library is Designed to Help

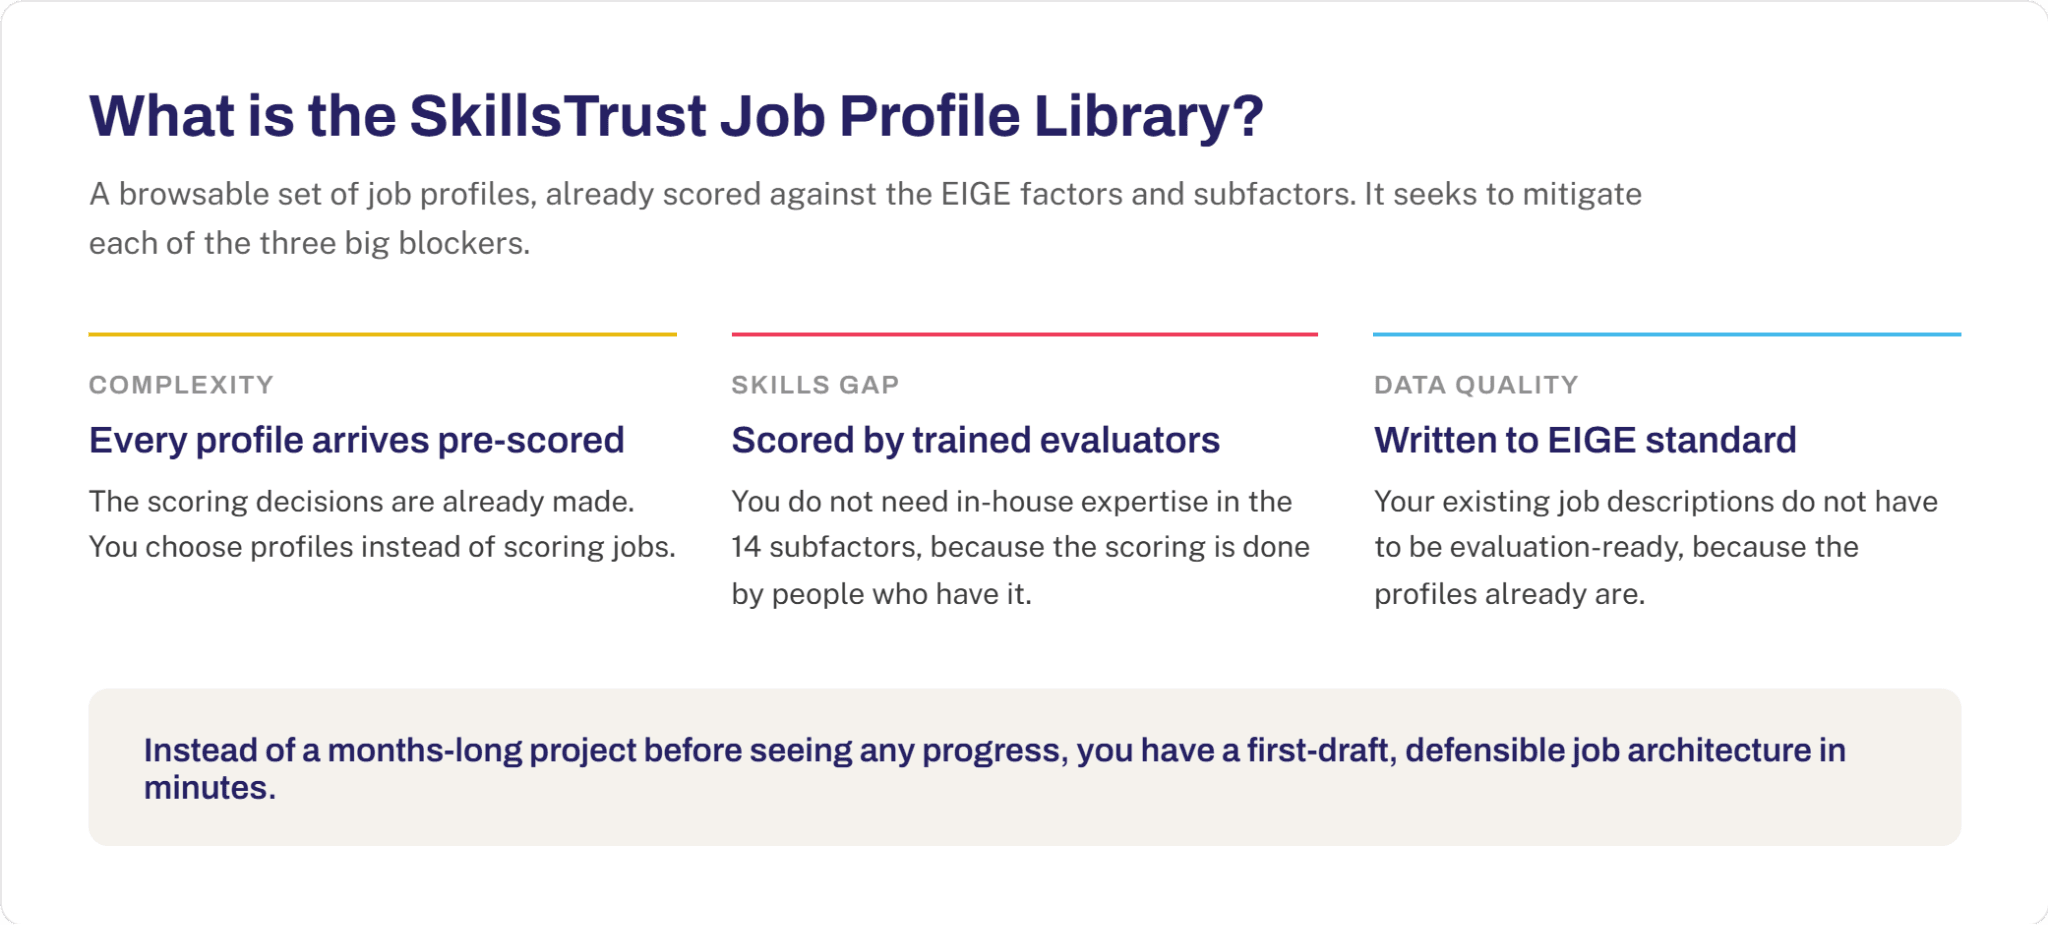
This week's launch of the Job Profile Library is a big step toward that mission. It's built on what we've learned helping dozens of companies build job architecture across a range of industries. Our aim is to get employers past the blockers that stop them from getting started:

  • Minimising complexity: Every profile arrives pre-scored, so you're choosing from a set of jobs rather than scoring them yourself.

  • Evaluated by Experts: The library's profiles are scored by people who do have that expertise, so you don't need it on your own team to get started.

  • High Quality Job Profiles: The library's job profiles are already written in the EIGE-recommended format, so your own job descriptions don't need to be evaluation-ready first.

The result: instead of a months-long project before seeing any progress, you have a first-draft, defensible job architecture in minutes. 
How to build your job architecture in minutes.

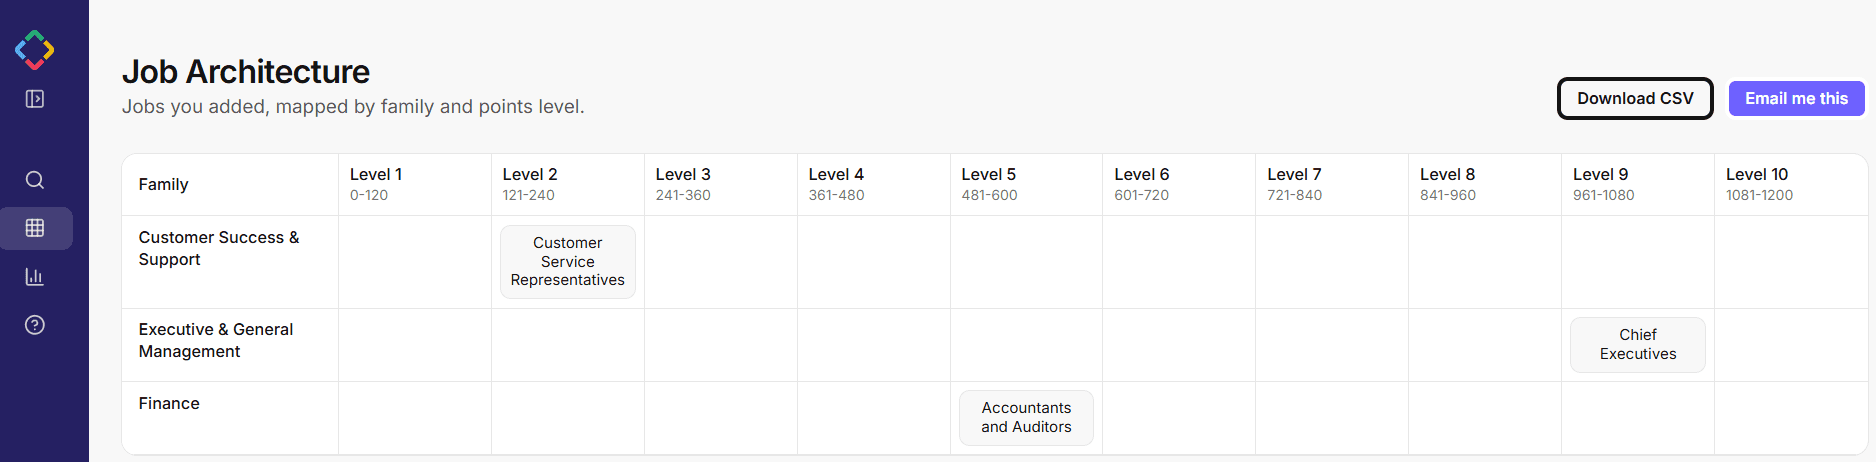
The free version of the library lets you search and browse pre-scored job profiles, then add up to 20 profiles to build out your own job architecture. Once you're happy with it, download the full architecture — including the job group and subfactor scores of every job — or email it straight to your inbox. If a Job you need isn't in the library yet, you can request it directly, and we'll add it to the queue.

Our recommendations on where to start.

A simple way to start building a job architecture is to pick a representative subset of jobs to act as your anchors. These jobs should reflect a cross section of your organisation. We suggest including: 

  • Your most senior and most junior jobs, to set the top and bottom of the points range.

  • Your highest-headcount jobs, since they affect the most employees.

  • A spread across job families and seniority levels, to fill out the picture in between.

Search each one in the library, add it to your job architecture using the purple ‘Add to Job Architecture’ button. 10-15 well-chosen anchor jobs is a good place to start. 

In a few minutes, you'll have a first-draft job architecture covering the shape of your whole company, without having scored a single job yourself.
If you want to keep building, the paid version of the software lets you edit and re-score profiles to match your organisation exactly, collaborate with your team on reviews with a full audit trail, and connect your job architecture to your payroll data to run a pay gap report.

Job architecture projects don’t need to sink your team's time. With the right tools, a previously overwhelming project becomes much more manageable. 

Try the Job Profile Library for free

Read more articles

Michelle Dervan

24 Aug 2026

Understanding & Triaging Your Pay Gaps | Pay Gap Analytics 101

Our most recent piece covered what goes into an EU Pay Gap Report: the data, the calculations, and what gets published. Having the pay gap numbers is one thing. Understanding what they mean is another. In this piece, we look at how to interpret your company-level pay gap first, then how to dig into any category-level gaps of 5% or more (the threshold set by the EU Pay Transparency Directive) and work out whether a gap is justified or needs remediation. We recommend a simple 5-step process you can use to identify which employees need a detailed pay review as part of diagnosing category-level pay gaps. As always, this is written for small HR teams without a dedicated Rewards function. What's driving your company’s pay gap? Two different factors can drive the company-level gender pay gap: Representation Equal Pay Dynamics. It’s important to look at the impact of each as they require different fixes. Representation as a driver of the pay gap. If women make up a very small percentage of your top earners, you'll see a pay gap even if there is equal pay for equal work between men and women doing like work. The impact of representation can be seen in your pay quartile data, the split of men and women in each quartile of your pay distribution. A pattern like 72% men and 28% women in your top pay quartile, narrowing to 26% men and 74% women in your bottom pay quartile, will produce a significant company level pay gap, even if there is pay parity between men and women in the same job category. Tackling representation as a driver of the pay gap is about intentional hiring, retention and progression policies and working to ensure even representation across the best-paying and least-well-paying jobs. Equal Pay Dynamics. The second driver of the pay gap is equal pay for equal value (i.e. the pay gap between men and women performing work in the same job category). This is the primary focus of the EU Pay Transparency Directive. Specifically, the Directive requires that a pay gap of 5% or more within any job category must either have an objective justification or be remediated. The rest of this article will focus on a process you can follow to determine whether there is objective justification for a category-level gap of 5% or more. How to tell if a category-level pay gap of 5% or more is justified? If you're not running a large comp team with dedicated software, here's a manual 5-Step Process of Elimination you can use. Step one: prioritise categories by headcount. Look at every job category with a gap of 5% or more. Rank the job categories by number of employees affected, largest to smallest, and start your review with the largest. As a rule of thumb, categories with fewer than three men and three women should be set aside and reviewed separately, since very small samples like this are naturally prone to distortion. Step two: data quality test. Before assuming there's a problem, check for two common causes. The first is poor pay data quality, most commonly an employee's hours not being adjusted to reflect a partial year, or an unflagged period of long-term sick or parental leave, either of which can make someone's pay look artificially high or low. The second is potential job architecture quality issues, where roles that aren't actually equal in value have been mis-grouped into the same category. Review and resolve any data quality issues or job architecture inaccuracies before proceeding. Step three: triage the gap by root cause. The pay gap may be systemic with most employees of one gender sitting in the lower half of the pay distribution or it may be more localised and driven by a small number of extreme earners (i.e. outliers). As a rule of thumb, we define outliers as anyone paid below 80% or above 120% of the median in their job category. Start by looking at the gender distribution within the pay range to check for clustering by gender in the lower or upper half. Then test the impact of excluding outliers or adjusting them to be within range. If the gap is resolved this way, the task becomes individual: is each outlier's pay objectively justified, or do they need to be red-circled at the high end (pay frozen until the range catches up) or adjusted upward at the low end? If outliers aren't the whole story and the gap holds even once they're accounted for, then move on to Step four to find which pay element is actually driving it. Step four: pay element test. For gaps that are not driven solely by outliers, next look to isolate the main driver of the gap. Look at the pay gap for total pay and then for base only, variable only, and benefits in kind (BIK) only, to determine which pay component (if any) is the primary driver. As an example, you might find that base pay sits well within the 5% threshold, but variable pay is showing a gap of over 20%. That tells you where to focus. For base pay specifically, look at both an individual's positioning within their range and whether there are pay range differences between job families sitting within the same category. Step five: policy alignment test. Take the individuals affected by the pay component driving the gap, and check each one against your own policy: does their pay position match what policy says it should be, given their experience, tenure, or performance rating? For bonus and benefits in kind, check whether eligibility rules were applied consistently, not just documented. A gender-neutral policy, correctly applied, is your objective justification. If the policy is neutral on paper but its outcome consistently disadvantages one gender in practice, that's not a justification, it's a signal something in how the policy is being applied needs fixing. What happens if the gap isn't justified? By the end of this step, you should have a set of actionable findings: a category has a gap above 5%, driven by a particular pay element. Most employees are paid in line with policy but a smaller group aren't, and there's no objective reason why. That group is now your remediation target: you know exactly who they are, what it would cost to move them to their policy-aligned position, and how much that closes the category gap. As a reminder, employers are required to either remediate this gap to below 5% within 6 months or carry out a joint pay assessment with workers' representatives, which means diagnosing the cause(s) of the gap, reviewing what's been done about it so far, and putting corrective measures in place. Once you've worked through your data, understood what's driving your gaps, and either justified or remediated them, you're in a strong position heading into your first pay gap reporting cycle. The process outlined here works well if you're checking a handful of small categories by hand. If you're running it for hundreds of employees, software like SkillsTrust can automate the steps so you get the insights you need faster. Book a demo to see how it works.

Read article

Michelle Dervan

24 Aug 2026

Understanding & Triaging Your Pay Gaps | Pay Gap Analytics 101

Our most recent piece covered what goes into an EU Pay Gap Report: the data, the calculations, and what gets published. Having the pay gap numbers is one thing. Understanding what they mean is another. In this piece, we look at how to interpret your company-level pay gap first, then how to dig into any category-level gaps of 5% or more (the threshold set by the EU Pay Transparency Directive) and work out whether a gap is justified or needs remediation. We recommend a simple 5-step process you can use to identify which employees need a detailed pay review as part of diagnosing category-level pay gaps. As always, this is written for small HR teams without a dedicated Rewards function. What's driving your company’s pay gap? Two different factors can drive the company-level gender pay gap: Representation Equal Pay Dynamics. It’s important to look at the impact of each as they require different fixes. Representation as a driver of the pay gap. If women make up a very small percentage of your top earners, you'll see a pay gap even if there is equal pay for equal work between men and women doing like work. The impact of representation can be seen in your pay quartile data, the split of men and women in each quartile of your pay distribution. A pattern like 72% men and 28% women in your top pay quartile, narrowing to 26% men and 74% women in your bottom pay quartile, will produce a significant company level pay gap, even if there is pay parity between men and women in the same job category. Tackling representation as a driver of the pay gap is about intentional hiring, retention and progression policies and working to ensure even representation across the best-paying and least-well-paying jobs. Equal Pay Dynamics. The second driver of the pay gap is equal pay for equal value (i.e. the pay gap between men and women performing work in the same job category). This is the primary focus of the EU Pay Transparency Directive. Specifically, the Directive requires that a pay gap of 5% or more within any job category must either have an objective justification or be remediated. The rest of this article will focus on a process you can follow to determine whether there is objective justification for a category-level gap of 5% or more. How to tell if a category-level pay gap of 5% or more is justified? If you're not running a large comp team with dedicated software, here's a manual 5-Step Process of Elimination you can use. Step one: prioritise categories by headcount. Look at every job category with a gap of 5% or more. Rank the job categories by number of employees affected, largest to smallest, and start your review with the largest. As a rule of thumb, categories with fewer than three men and three women should be set aside and reviewed separately, since very small samples like this are naturally prone to distortion. Step two: data quality test. Before assuming there's a problem, check for two common causes. The first is poor pay data quality, most commonly an employee's hours not being adjusted to reflect a partial year, or an unflagged period of long-term sick or parental leave, either of which can make someone's pay look artificially high or low. The second is potential job architecture quality issues, where roles that aren't actually equal in value have been mis-grouped into the same category. Review and resolve any data quality issues or job architecture inaccuracies before proceeding. Step three: triage the gap by root cause. The pay gap may be systemic with most employees of one gender sitting in the lower half of the pay distribution or it may be more localised and driven by a small number of extreme earners (i.e. outliers). As a rule of thumb, we define outliers as anyone paid below 80% or above 120% of the median in their job category. Start by looking at the gender distribution within the pay range to check for clustering by gender in the lower or upper half. Then test the impact of excluding outliers or adjusting them to be within range. If the gap is resolved this way, the task becomes individual: is each outlier's pay objectively justified, or do they need to be red-circled at the high end (pay frozen until the range catches up) or adjusted upward at the low end? If outliers aren't the whole story and the gap holds even once they're accounted for, then move on to Step four to find which pay element is actually driving it. Step four: pay element test. For gaps that are not driven solely by outliers, next look to isolate the main driver of the gap. Look at the pay gap for total pay and then for base only, variable only, and benefits in kind (BIK) only, to determine which pay component (if any) is the primary driver. As an example, you might find that base pay sits well within the 5% threshold, but variable pay is showing a gap of over 20%. That tells you where to focus. For base pay specifically, look at both an individual's positioning within their range and whether there are pay range differences between job families sitting within the same category. Step five: policy alignment test. Take the individuals affected by the pay component driving the gap, and check each one against your own policy: does their pay position match what policy says it should be, given their experience, tenure, or performance rating? For bonus and benefits in kind, check whether eligibility rules were applied consistently, not just documented. A gender-neutral policy, correctly applied, is your objective justification. If the policy is neutral on paper but its outcome consistently disadvantages one gender in practice, that's not a justification, it's a signal something in how the policy is being applied needs fixing. What happens if the gap isn't justified? By the end of this step, you should have a set of actionable findings: a category has a gap above 5%, driven by a particular pay element. Most employees are paid in line with policy but a smaller group aren't, and there's no objective reason why. That group is now your remediation target: you know exactly who they are, what it would cost to move them to their policy-aligned position, and how much that closes the category gap. As a reminder, employers are required to either remediate this gap to below 5% within 6 months or carry out a joint pay assessment with workers' representatives, which means diagnosing the cause(s) of the gap, reviewing what's been done about it so far, and putting corrective measures in place. Once you've worked through your data, understood what's driving your gaps, and either justified or remediated them, you're in a strong position heading into your first pay gap reporting cycle. The process outlined here works well if you're checking a handful of small categories by hand. If you're running it for hundreds of employees, software like SkillsTrust can automate the steps so you get the insights you need faster. Book a demo to see how it works.

Read article

The information on this page is not intended to serve and does not serve as legal advice. All of the content, information, and material on this website are only for general informational use.

Copyright © 2026 SkillsTrust. All Rights Reserved.

The information on this page is not intended to serve and does not serve as legal advice. All of the content, information, and material on this website are only for general informational use.

Copyright © 2026 SkillsTrust. All Rights Reserved.

The information on this page is not intended to serve and does not serve as legal advice. All of the content, information, and material on this website are only for general informational use.

Copyright © 2026 SkillsTrust. All Rights Reserved.

The information on this page is not intended to serve and does not serve as legal advice. All of the content, information, and material on this website are only for general informational use.

Copyright © 2026 SkillsTrust. All Rights Reserved.