
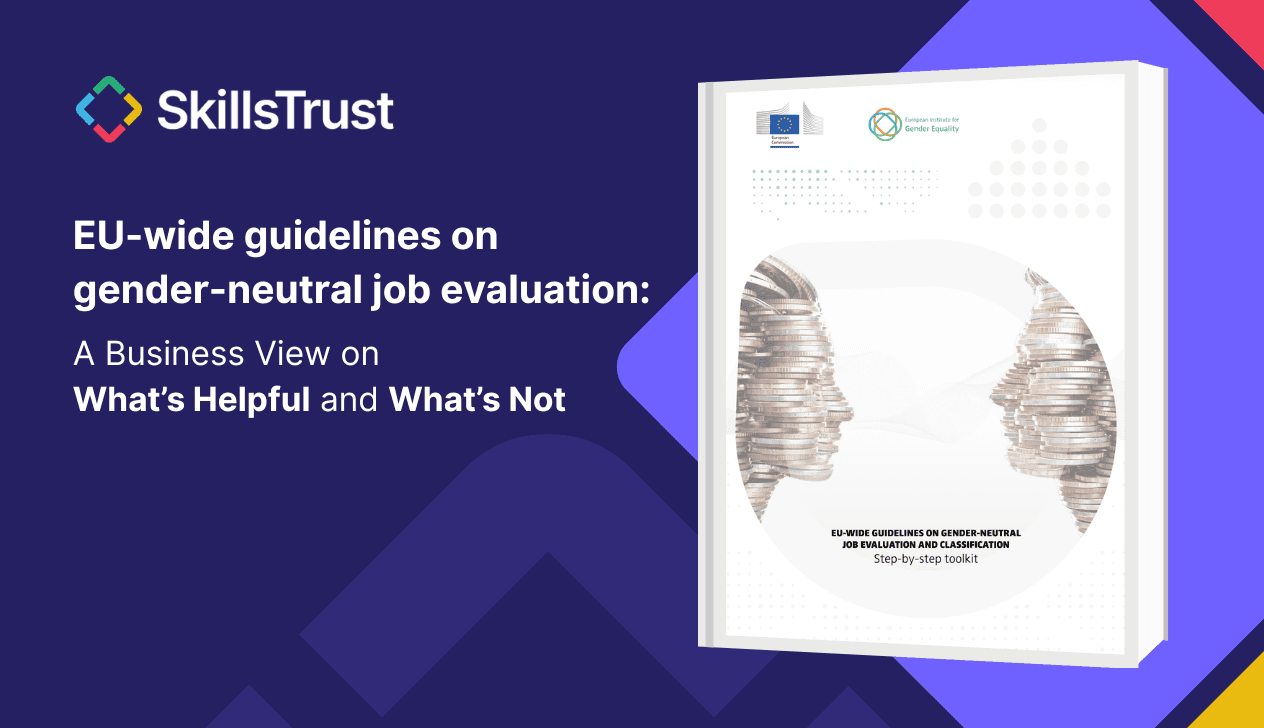
EU-wide guidelines on gender-neutral job evaluation: A Business View on What’s Helpful and What’s Not

SkillsTrust

• 4 minute read

EU-wide guidelines on gender-neutral job evaluation: A Business View on What’s Helpful and What’s Not

Almost three years after its approval, the EU Pay Transparency Directive is moving towards implementation but the exact timing remains unclear, as many member states have yet to transpose it into national law.

Despite this uncertainty, employers are under growing pressure to prepare. One of the most challenging aspects has been job categorisation: what compliant job categories should look like in practice, and how organisations are expected to implement them.

Some clarity finally arrived on March 27th with the publication of EU-wide guidelines on gender-neutral job evaluation by the European Institute for Gender Equality (EIGE), endorsed by the European Commission.

The question now is whether these guidelines are practical for employers - or whether they assume a level of time, resource and administrative effort that many organisations simply don’t have. 

This article looks at what the guidelines get right, where they fall short, and what this means in practice for employers.

Overview of the Guidelines

The guidelines offer three different job evaluation approaches based on company size:

  • Micro companies (<10 employees)

  • Small & Medium companies (up to 250 employees and <15 jobs)

  • Large companies (>15 jobs)

Here, I focus on large companies, as in practice, most organisations have more than 15 jobs.

What’s Helpful

The EIGE Guidelines provide welcome clarity by aligning behind a standardised approach to job evaluation. For large companies, the guidelines endorse the use of a point-factor methodology with predefined factor definitions, subfactors, scoring scales, weights and formula. For many organisations - particularly those without in-house rewards expertise - getting access to this kind of clear structure is genuinely helpful and removes a significant amount of guesswork.

More broadly, it reinforces sound principles: that jobs should be evaluated in a structured way across multiple dimensions, that job documentation matters, and that validation of scoring by multiple stakeholders is necessary.

Where It Falls Short

Timing. The toolkit suggests the job evaluation process will take around six months to implement, yet it was published less than three months before the Directive is due to come into force. In reality, job evaluation projects often take significantly longer - according to Deloitte’s annual job architecture survey, often up to two years - placing many employers in a pressurised position.

Complexity. The complexity of the framework is another major challenge. Each job is assessed across 4 factors (skills, effort, responsibility and working conditions), with 14 subfactors beneath them. This scales quickly. For a company with 150 jobs, this results in 2,100 individual scoring decisions. When five evaluators are involved (as suggested), this rises to over 10,000 scores that must then be set, reviewed, discussed and aligned.

Skills Gap. The expectations around evaluator capability also add friction. The toolkit assumes that evaluators can be trained to apply 14 subfactors consistently and objectively across all jobs. In reality, many organisations do not have in-house job evaluation expertise, and achieving consistent interpretation of scoring criteria across multiple evaluators is itself a non-trivial exercise particularly under time pressure.

Validation burden. Crucially, the burden is not just in scoring - but in validation. The prescribed approach requires each evaluator to assess all jobs independently before reconciling differences through structured calibration sessions. In practice, this creates a coordination challenge as much as an analytical one: aligning five stakeholders across hundreds of jobs requires repeated workshops, detailed justifications, and documentation of decisions. This level of involvement is difficult to sustain alongside day-to-day business responsibilities.

Data Quality. There is also a significant dependency on high-quality, standardised job documentation. The methodology assumes that jobs are described in sufficient detail to support scoring across all factors and subfactors. In practice, job descriptions are often inconsistent, outdated, or written for hiring rather than evaluation purposes. This creates an additional upfront workload: jobs must first be rewritten or standardised before they can even be evaluated reliably.

Tooling Gap. Finally, the tools provided - primarily Word docs and spreadsheets - do not support managing this process efficiently at scale. Version control, collaboration, and auditability very quickly become challenging, leaving organisations to design and maintain their own systems around the methodology.

All of this sits at odds with the reality in most businesses. A mid-sized company with 500 employees and 150 jobs may have an HR team of up to four people, often without dedicated Rewards expertise. The level of effort assumed by the toolkit does not reflect these constraints.

The Core Issue

The challenge is not with the underlying methodology. It makes sense to evaluate jobs across multiple dimensions, to ensure job documentation is robust, and to involve human judgment in validating outcomes.

The difficulty lies in how the process is expected to be carried out. The approach assumes a manual, highly resource-intensive way of working that feels out of step with how organisations operate today. The process as outlined by EIGE would have been carried out the same way 20 or 30 years ago as they are suggesting it be done today.

A More Practical Approach in 2026

A more realistic approach is to retain the EIGE methodology, but fundamentally rethink how it is delivered.

EIGE manual model:

  • Job descriptions are created and reviewed manually, with no consistent standard of quality

  • Five evaluators independently score every job across all factors

  • Differences are resolved through full reconciliation workshops

  • Progress is tracked across spreadsheets and documents

This approach is thorough, but difficult to execute at scale - particularly under time and resource constraints.

Tech-enabled model (EIGE-aligned):

  • Job descriptions are standardised and quality-checked using AI against EIGE criteria

  • Baseline scoring is generated based on job content

  • Human evaluators focus on validating, adjusting, and calibrating scores—rather than creating them from scratch

  • A system-generated audit trail tracks how scores evolve, flags inconsistencies, and highlights where job content does not support evaluation outcomes

This represents a shift from a fully manual process to a hybrid model where technology handles scale and consistency, and humans provide judgment and accountability.

Crucially, this is not about reducing rigour - it is about making rigour operationally achievable.

Job evaluation is not an end in itself; its purpose is to underpin defensible pay outcomes. Any approach that is too slow, inconsistent, or difficult to maintain risks undermining that objective.

Conclusion

The EIGE toolkit is a positive step in that it provides structure and clarity on an important aspect of the Pay Transparency Directive. However, in its current form, it is too complex, manual and resource-intensive for many organisations to implement, particularly given the timelines involved.

For most employers, the path forward will not be to reject the methodology, but to find practical ways of applying it - leveraging technology and modern tools to reduce the administrative burden while still meeting the intent of the guidelines.

Want to implement pay transparency in a tech-enabled way at your company? See how SkillsTrust helps HR teams operationalise pay transparency in a practical way. Chat with our team.  

Read more articles

Michelle Dervan

2 Nov 2026

All About Averages | Pay Analytics 101

The Importance of the Average When talking about pay data, the term average appears time and time again, but what does it actually mean? Put simply, an average salary gives us one figure to help describe pay across a group of employees. It takes all the salary values from that group and calculates a figure that would represent a ‘typical’ employee in that group. This is useful because it allows us to compare pay between different employee groups without having to look at every individual salary. The average can become an even more powerful metric when we begin to understand and analyse the different ways it’s calculated. It might seem counterintuitive that a figure like the average can be calculated in different ways and possibly provide different answers. After all, how can the same set of salaries produce different averages? The key is that each method looks at the data differently, helping us bring a different part of the picture into focus. There are two types of average that are particularly important when it comes to understanding pay: the mean and the median. So, how do they work, and what can each tell us about pay? Let's introduce them using a simple example company, PeopleTech Ltd. The Mean: What would everyone earn if pay were shared equally? The mean is what many people think of when they hear the word average. It shows us what each employee would earn if the company's total pay were shared equally among everyone. In everyday conversation, the terms mean and average are often used interchangeably. However, this isn't technically accurate, as the mean is just one of the ways to calculate an average, as we'll explore later on. To calculate the mean, we simply add together all the salaries and divide the total by the number of employees. Let's look at the example company, PeopleTech Ltd. Imagine the five employees earn the following annual salaries: €30,000 + €40,000 + €40,000 + €50,000 + €100,000 = €260,000 PeopleTech Ltd. has a total annual salary bill of €260,000 across its five employees. To calculate the mean, we divide this total by five: €260,000 ÷ 5 = €52,000 So, the mean salary at PeopleTech Ltd. is €52,000. In other words, if the company's total salary bill were shared equally between all five employees, each person would receive €52,000. The mean is useful because it gives us an overall picture of pay across the company. However, as we'll see, it doesn't always reflect what most employees actually earn, particularly when there are significant differences between the highest and lowest salaries. The Median: What is the salary in the middle? But what happens when one or two employees earn significantly more than everyone else? This is where the median can give us a different perspective. While the mean looks at the total of all salaries, the median looks directly at the middle of the data. Imagine arranging all our employees in a straight line, from the lowest-paid to the highest-paid. The salary of the person standing in the middle would represent our median salary. Let's look at PeopleTech Ltd. again. Using the same salaries as before, we arrange them from lowest to highest: €30,000 | €40,000 | €40,000 | €50,000 | €100,000 The middle salary is €40,000, making this the median salary for PeopleTech Ltd. What makes the median particularly useful is that it is not affected by unusually high or low salaries, often referred to as outliers. In our example, let's assume the €100,000 salary belongs to the CEO, which is double the next highest salary. This unusually high salary pulls the mean upwards, making the average salary appear higher than what most employees actually earn. The median, however, is not affected by this unusually high salary. At €40,000, it gives us a different perspective on what a typical employee earns in PeopleTech Ltd. This is particularly useful for HR professionals because it helps us understand what employees typically earn, without the results being skewed by a small number of particularly high or low salaries. Neither figure is wrong. They simply tell us different things about how pay is distributed across the company. Looking at both together gives us a more complete picture than relying on either one alone. One thing to note: when there is an even number of employees, there won't be one person sitting exactly in the middle. In this case, we take the two middle salaries and calculate their average to find the median. How does this all relate to the EU Pay Transparency Directive? The EU Pay Transparency Directive requires employers to report on both the mean and median gender pay gap. These gaps are calculated by finding the average pay for male employees and the average pay for female employees, and then measuring the difference between them. The difference is expressed as a percentage of men's average pay. For example, a gender pay gap of +10% means that women's average pay is 10% lower than men's average pay. But why does the Directive want to look at both figures? The size of a company's mean gender pay gap and median gender pay gap can tell us different things about how pay is distributed across the organisation. If a company's mean gender pay gap is larger than its median gender pay gap, this could suggest that higher-paid employees are having a greater influence on the overall gap. Think back to our PeopleTech Ltd. example, where the CEO's €100,000 salary pulled the mean upwards. A similar effect could occur in an organisation where the pay gap between most male and female employees is relatively small, but a highly paid position, such as the CEO role, is occupied by a man. Even though the difference in pay across the wider workforce may be relatively modest, this one high salary could pull the mean upwards and result in a much larger overall gender pay gap. On the other hand, if a company's median gender pay gap is larger than its mean gender pay gap, this could suggest that the difference in pay is more evident across the wider workforce, rather than being driven primarily by a small number of highly or lower paid positions. In other words, the gap may be more noticeable among employees around the middle of the pay distribution, rather than being concentrated at the top. This could highlight wider differences in how men and women are paid across the organisation, and may warrant further investigation. It is important to remember that neither the mean nor the median tells us exactly why a gender pay gap exists. They are indicators that help us identify patterns and differences in pay, rather than explanations in themselves. By looking at both measures together, HR professionals can begin to build a clearer picture of pay within their organisation, identify areas that may need further investigation and take a more informed approach to understanding and addressing any gaps.

Read article

Michelle Dervan

2 Nov 2026

All About Averages | Pay Analytics 101

The Importance of the Average When talking about pay data, the term average appears time and time again, but what does it actually mean? Put simply, an average salary gives us one figure to help describe pay across a group of employees. It takes all the salary values from that group and calculates a figure that would represent a ‘typical’ employee in that group. This is useful because it allows us to compare pay between different employee groups without having to look at every individual salary. The average can become an even more powerful metric when we begin to understand and analyse the different ways it’s calculated. It might seem counterintuitive that a figure like the average can be calculated in different ways and possibly provide different answers. After all, how can the same set of salaries produce different averages? The key is that each method looks at the data differently, helping us bring a different part of the picture into focus. There are two types of average that are particularly important when it comes to understanding pay: the mean and the median. So, how do they work, and what can each tell us about pay? Let's introduce them using a simple example company, PeopleTech Ltd. The Mean: What would everyone earn if pay were shared equally? The mean is what many people think of when they hear the word average. It shows us what each employee would earn if the company's total pay were shared equally among everyone. In everyday conversation, the terms mean and average are often used interchangeably. However, this isn't technically accurate, as the mean is just one of the ways to calculate an average, as we'll explore later on. To calculate the mean, we simply add together all the salaries and divide the total by the number of employees. Let's look at the example company, PeopleTech Ltd. Imagine the five employees earn the following annual salaries: €30,000 + €40,000 + €40,000 + €50,000 + €100,000 = €260,000 PeopleTech Ltd. has a total annual salary bill of €260,000 across its five employees. To calculate the mean, we divide this total by five: €260,000 ÷ 5 = €52,000 So, the mean salary at PeopleTech Ltd. is €52,000. In other words, if the company's total salary bill were shared equally between all five employees, each person would receive €52,000. The mean is useful because it gives us an overall picture of pay across the company. However, as we'll see, it doesn't always reflect what most employees actually earn, particularly when there are significant differences between the highest and lowest salaries. The Median: What is the salary in the middle? But what happens when one or two employees earn significantly more than everyone else? This is where the median can give us a different perspective. While the mean looks at the total of all salaries, the median looks directly at the middle of the data. Imagine arranging all our employees in a straight line, from the lowest-paid to the highest-paid. The salary of the person standing in the middle would represent our median salary. Let's look at PeopleTech Ltd. again. Using the same salaries as before, we arrange them from lowest to highest: €30,000 | €40,000 | €40,000 | €50,000 | €100,000 The middle salary is €40,000, making this the median salary for PeopleTech Ltd. What makes the median particularly useful is that it is not affected by unusually high or low salaries, often referred to as outliers. In our example, let's assume the €100,000 salary belongs to the CEO, which is double the next highest salary. This unusually high salary pulls the mean upwards, making the average salary appear higher than what most employees actually earn. The median, however, is not affected by this unusually high salary. At €40,000, it gives us a different perspective on what a typical employee earns in PeopleTech Ltd. This is particularly useful for HR professionals because it helps us understand what employees typically earn, without the results being skewed by a small number of particularly high or low salaries. Neither figure is wrong. They simply tell us different things about how pay is distributed across the company. Looking at both together gives us a more complete picture than relying on either one alone. One thing to note: when there is an even number of employees, there won't be one person sitting exactly in the middle. In this case, we take the two middle salaries and calculate their average to find the median. How does this all relate to the EU Pay Transparency Directive? The EU Pay Transparency Directive requires employers to report on both the mean and median gender pay gap. These gaps are calculated by finding the average pay for male employees and the average pay for female employees, and then measuring the difference between them. The difference is expressed as a percentage of men's average pay. For example, a gender pay gap of +10% means that women's average pay is 10% lower than men's average pay. But why does the Directive want to look at both figures? The size of a company's mean gender pay gap and median gender pay gap can tell us different things about how pay is distributed across the organisation. If a company's mean gender pay gap is larger than its median gender pay gap, this could suggest that higher-paid employees are having a greater influence on the overall gap. Think back to our PeopleTech Ltd. example, where the CEO's €100,000 salary pulled the mean upwards. A similar effect could occur in an organisation where the pay gap between most male and female employees is relatively small, but a highly paid position, such as the CEO role, is occupied by a man. Even though the difference in pay across the wider workforce may be relatively modest, this one high salary could pull the mean upwards and result in a much larger overall gender pay gap. On the other hand, if a company's median gender pay gap is larger than its mean gender pay gap, this could suggest that the difference in pay is more evident across the wider workforce, rather than being driven primarily by a small number of highly or lower paid positions. In other words, the gap may be more noticeable among employees around the middle of the pay distribution, rather than being concentrated at the top. This could highlight wider differences in how men and women are paid across the organisation, and may warrant further investigation. It is important to remember that neither the mean nor the median tells us exactly why a gender pay gap exists. They are indicators that help us identify patterns and differences in pay, rather than explanations in themselves. By looking at both measures together, HR professionals can begin to build a clearer picture of pay within their organisation, identify areas that may need further investigation and take a more informed approach to understanding and addressing any gaps.

Read article

The information on this page is not intended to serve and does not serve as legal advice. All of the content, information, and material on this website are only for general informational use.

Copyright © 2026 SkillsTrust. All Rights Reserved.

The information on this page is not intended to serve and does not serve as legal advice. All of the content, information, and material on this website are only for general informational use.

Copyright © 2026 SkillsTrust. All Rights Reserved.

The information on this page is not intended to serve and does not serve as legal advice. All of the content, information, and material on this website are only for general informational use.

Copyright © 2026 SkillsTrust. All Rights Reserved.

The information on this page is not intended to serve and does not serve as legal advice. All of the content, information, and material on this website are only for general informational use.

Copyright © 2026 SkillsTrust. All Rights Reserved.