
Understanding & Triaging Your Pay Gaps | Pay Gap Analytics 101

SkillsTrust

• 4 minute read

Our most recent piece covered what goes into an EU Pay Gap Report: the data, the calculations, and what gets published.

Having the pay gap numbers is one thing. Understanding what they mean is another. In this piece, we look at how to interpret your company-level pay gap first, then how to dig into any category-level gaps of 5% or more (the threshold set by the EU Pay Transparency Directive) and work out whether a gap is justified or needs remediation. We recommend a simple 5-step process you can use to identify which employees need a detailed pay review as part of diagnosing category-level pay gaps. As always, this is written for small HR teams without a dedicated Rewards function. 

What's driving your company’s pay gap?

Two different factors can drive the company-level gender pay gap: 

  • Representation 

  • Equal Pay Dynamics. 

It’s important to look at the impact of each as they require different fixes.

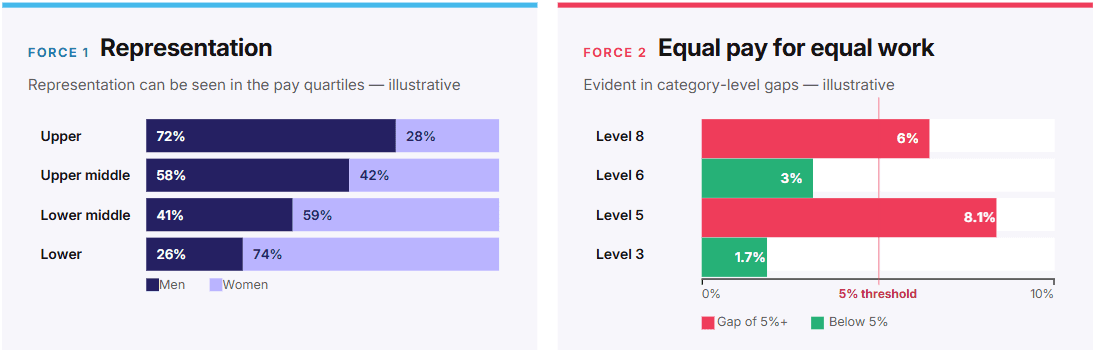
Representation as a driver of the pay gap. If women make up a very small percentage of your top earners, you'll see a pay gap even if there is equal pay for equal work between men and women doing like work. The impact of representation can be seen in your pay quartile data, the split of men and women in each quartile of your pay distribution. A pattern like 72% men and 28% women in your top pay quartile, narrowing to 26% men and 74% women in your bottom pay quartile, will produce a significant company level pay gap, even if there is pay parity between men and women in the same job category. Tackling representation as a driver of the pay gap is about intentional hiring, retention and progression policies and working to ensure even representation across the best-paying and least-well-paying jobs. 

Equal Pay Dynamics. The second driver of the pay gap is equal pay for equal value (i.e. the pay gap between men and women performing work in the same job category). This is the primary focus of the EU Pay Transparency Directive. Specifically, the Directive requires that a pay gap of 5% or more within any job category must either have an objective justification or be remediated. The rest of this article will focus on a process you can follow to determine whether there is objective justification for a category-level gap of 5% or more. 

How to tell if a category-level pay gap of 5% or more is justified?

If you're not running a large comp team with dedicated software, here's a manual 5-Step Process of Elimination you can use.
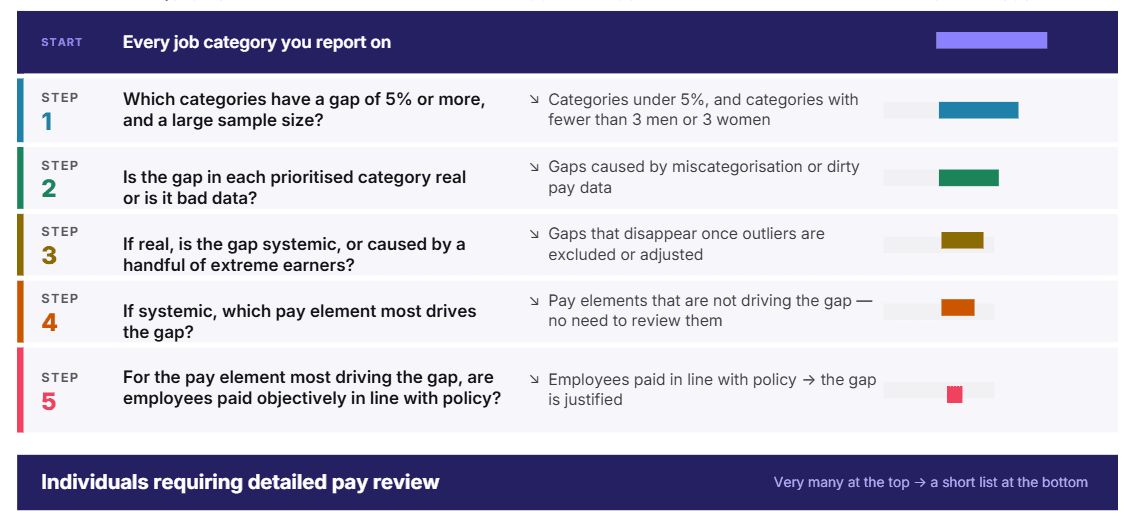
Step one: prioritise categories by headcount. Look at every job category with a gap of 5% or more. Rank the job categories by number of employees affected, largest to smallest, and start your review with the largest. As a rule of thumb, categories with fewer than three men and three women should be set aside and reviewed separately, since very small samples like this are naturally prone to distortion. 

Step two: data quality test. Before assuming there's a problem, check for two common causes. The first is poor pay data quality, most commonly an employee's hours not being adjusted to reflect a partial year, or an unflagged period of long-term sick or parental leave, either of which can make someone's pay look artificially high or low. The second is potential job architecture quality issues, where roles that aren't actually equal in value have been mis-grouped into the same category. Review and resolve any data quality issues or job architecture inaccuracies before proceeding. 

Step three: triage the gap by root cause. The pay gap may be systemic with most employees of one gender sitting in the lower half of the pay distribution or it may be more localised and driven by a small number of extreme earners (i.e. outliers). As a rule of thumb, we define outliers as anyone paid below 80% or above 120% of the median in their job category. Start by looking at the gender distribution within the pay range to check for clustering by gender in the lower or upper half. Then test the impact of excluding outliers or adjusting them to be within range. If the gap is resolved this way, the task becomes individual: is each outlier's pay objectively justified, or do they need to be red-circled at the high end (pay frozen until the range catches up) or adjusted upward at the low end?

If outliers aren't the whole story and the gap holds even once they're accounted for, then move on to Step four to find which pay element is actually driving it.

Step four: pay element test. For gaps that are not driven solely by outliers, next look to isolate the main driver of the gap. Look at the pay gap for total pay and then for base only, variable only, and benefits in kind (BIK) only, to determine which pay component (if any) is the primary driver. As an example, you might find that base pay sits well within the 5% threshold, but variable pay is showing a gap of over 20%. That tells you where to focus. For base pay specifically, look at both an individual's positioning within their range and whether there are pay range differences between job families sitting within the same category.

Step five: policy alignment test. Take the individuals affected by the pay component driving the gap, and check each one against your own policy: does their pay position match what policy says it should be, given their experience, tenure, or performance rating? For bonus and benefits in kind, check whether eligibility rules were applied consistently, not just documented. A gender-neutral policy, correctly applied, is your objective justification. If the policy is neutral on paper but its outcome consistently disadvantages one gender in practice, that's not a justification, it's a signal something in how the policy is being applied needs fixing. 

What happens if the gap isn't justified?

By the end of this step, you should have a set of actionable findings: a category has a gap above 5%, driven by a particular pay element. Most employees are paid in line with policy but a smaller group aren't, and there's no objective reason why. That group is now your remediation target: you know exactly who they are, what it would cost to move them to their policy-aligned position, and how much that closes the category gap. 

As a reminder, employers are required to either remediate this gap to below 5% within 6 months or carry out a joint pay assessment with workers' representatives, which means diagnosing the cause(s) of the gap, reviewing what's been done about it so far, and putting corrective measures in place.

Once you've worked through your data, understood what's driving your gaps, and either justified or remediated them, you're in a strong position heading into your first pay gap reporting cycle.

The process outlined here works well if you're checking a handful of small categories by hand. If you're running it for hundreds of employees, software like SkillsTrust can automate the steps so you get the insights you need faster. 

Book a demo to see how it works.

Read more articles

Michelle Dervan

2 Nov 2026

All About Averages | Pay Analytics 101

The Importance of the Average When talking about pay data, the term average appears time and time again, but what does it actually mean? Put simply, an average salary gives us one figure to help describe pay across a group of employees. It takes all the salary values from that group and calculates a figure that would represent a ‘typical’ employee in that group. This is useful because it allows us to compare pay between different employee groups without having to look at every individual salary. The average can become an even more powerful metric when we begin to understand and analyse the different ways it’s calculated. It might seem counterintuitive that a figure like the average can be calculated in different ways and possibly provide different answers. After all, how can the same set of salaries produce different averages? The key is that each method looks at the data differently, helping us bring a different part of the picture into focus. There are two types of average that are particularly important when it comes to understanding pay: the mean and the median. So, how do they work, and what can each tell us about pay? Let's introduce them using a simple example company, PeopleTech Ltd. The Mean: What would everyone earn if pay were shared equally? The mean is what many people think of when they hear the word average. It shows us what each employee would earn if the company's total pay were shared equally among everyone. In everyday conversation, the terms mean and average are often used interchangeably. However, this isn't technically accurate, as the mean is just one of the ways to calculate an average, as we'll explore later on. To calculate the mean, we simply add together all the salaries and divide the total by the number of employees. Let's look at the example company, PeopleTech Ltd. Imagine the five employees earn the following annual salaries: €30,000 + €40,000 + €40,000 + €50,000 + €100,000 = €260,000 PeopleTech Ltd. has a total annual salary bill of €260,000 across its five employees. To calculate the mean, we divide this total by five: €260,000 ÷ 5 = €52,000 So, the mean salary at PeopleTech Ltd. is €52,000. In other words, if the company's total salary bill were shared equally between all five employees, each person would receive €52,000. The mean is useful because it gives us an overall picture of pay across the company. However, as we'll see, it doesn't always reflect what most employees actually earn, particularly when there are significant differences between the highest and lowest salaries. The Median: What is the salary in the middle? But what happens when one or two employees earn significantly more than everyone else? This is where the median can give us a different perspective. While the mean looks at the total of all salaries, the median looks directly at the middle of the data. Imagine arranging all our employees in a straight line, from the lowest-paid to the highest-paid. The salary of the person standing in the middle would represent our median salary. Let's look at PeopleTech Ltd. again. Using the same salaries as before, we arrange them from lowest to highest: €30,000 | €40,000 | €40,000 | €50,000 | €100,000 The middle salary is €40,000, making this the median salary for PeopleTech Ltd. What makes the median particularly useful is that it is not affected by unusually high or low salaries, often referred to as outliers. In our example, let's assume the €100,000 salary belongs to the CEO, which is double the next highest salary. This unusually high salary pulls the mean upwards, making the average salary appear higher than what most employees actually earn. The median, however, is not affected by this unusually high salary. At €40,000, it gives us a different perspective on what a typical employee earns in PeopleTech Ltd. This is particularly useful for HR professionals because it helps us understand what employees typically earn, without the results being skewed by a small number of particularly high or low salaries. Neither figure is wrong. They simply tell us different things about how pay is distributed across the company. Looking at both together gives us a more complete picture than relying on either one alone. One thing to note: when there is an even number of employees, there won't be one person sitting exactly in the middle. In this case, we take the two middle salaries and calculate their average to find the median. How does this all relate to the EU Pay Transparency Directive? The EU Pay Transparency Directive requires employers to report on both the mean and median gender pay gap. These gaps are calculated by finding the average pay for male employees and the average pay for female employees, and then measuring the difference between them. The difference is expressed as a percentage of men's average pay. For example, a gender pay gap of +10% means that women's average pay is 10% lower than men's average pay. But why does the Directive want to look at both figures? The size of a company's mean gender pay gap and median gender pay gap can tell us different things about how pay is distributed across the organisation. If a company's mean gender pay gap is larger than its median gender pay gap, this could suggest that higher-paid employees are having a greater influence on the overall gap. Think back to our PeopleTech Ltd. example, where the CEO's €100,000 salary pulled the mean upwards. A similar effect could occur in an organisation where the pay gap between most male and female employees is relatively small, but a highly paid position, such as the CEO role, is occupied by a man. Even though the difference in pay across the wider workforce may be relatively modest, this one high salary could pull the mean upwards and result in a much larger overall gender pay gap. On the other hand, if a company's median gender pay gap is larger than its mean gender pay gap, this could suggest that the difference in pay is more evident across the wider workforce, rather than being driven primarily by a small number of highly or lower paid positions. In other words, the gap may be more noticeable among employees around the middle of the pay distribution, rather than being concentrated at the top. This could highlight wider differences in how men and women are paid across the organisation, and may warrant further investigation. It is important to remember that neither the mean nor the median tells us exactly why a gender pay gap exists. They are indicators that help us identify patterns and differences in pay, rather than explanations in themselves. By looking at both measures together, HR professionals can begin to build a clearer picture of pay within their organisation, identify areas that may need further investigation and take a more informed approach to understanding and addressing any gaps.

Read article

Michelle Dervan

2 Nov 2026

All About Averages | Pay Analytics 101

The Importance of the Average When talking about pay data, the term average appears time and time again, but what does it actually mean? Put simply, an average salary gives us one figure to help describe pay across a group of employees. It takes all the salary values from that group and calculates a figure that would represent a ‘typical’ employee in that group. This is useful because it allows us to compare pay between different employee groups without having to look at every individual salary. The average can become an even more powerful metric when we begin to understand and analyse the different ways it’s calculated. It might seem counterintuitive that a figure like the average can be calculated in different ways and possibly provide different answers. After all, how can the same set of salaries produce different averages? The key is that each method looks at the data differently, helping us bring a different part of the picture into focus. There are two types of average that are particularly important when it comes to understanding pay: the mean and the median. So, how do they work, and what can each tell us about pay? Let's introduce them using a simple example company, PeopleTech Ltd. The Mean: What would everyone earn if pay were shared equally? The mean is what many people think of when they hear the word average. It shows us what each employee would earn if the company's total pay were shared equally among everyone. In everyday conversation, the terms mean and average are often used interchangeably. However, this isn't technically accurate, as the mean is just one of the ways to calculate an average, as we'll explore later on. To calculate the mean, we simply add together all the salaries and divide the total by the number of employees. Let's look at the example company, PeopleTech Ltd. Imagine the five employees earn the following annual salaries: €30,000 + €40,000 + €40,000 + €50,000 + €100,000 = €260,000 PeopleTech Ltd. has a total annual salary bill of €260,000 across its five employees. To calculate the mean, we divide this total by five: €260,000 ÷ 5 = €52,000 So, the mean salary at PeopleTech Ltd. is €52,000. In other words, if the company's total salary bill were shared equally between all five employees, each person would receive €52,000. The mean is useful because it gives us an overall picture of pay across the company. However, as we'll see, it doesn't always reflect what most employees actually earn, particularly when there are significant differences between the highest and lowest salaries. The Median: What is the salary in the middle? But what happens when one or two employees earn significantly more than everyone else? This is where the median can give us a different perspective. While the mean looks at the total of all salaries, the median looks directly at the middle of the data. Imagine arranging all our employees in a straight line, from the lowest-paid to the highest-paid. The salary of the person standing in the middle would represent our median salary. Let's look at PeopleTech Ltd. again. Using the same salaries as before, we arrange them from lowest to highest: €30,000 | €40,000 | €40,000 | €50,000 | €100,000 The middle salary is €40,000, making this the median salary for PeopleTech Ltd. What makes the median particularly useful is that it is not affected by unusually high or low salaries, often referred to as outliers. In our example, let's assume the €100,000 salary belongs to the CEO, which is double the next highest salary. This unusually high salary pulls the mean upwards, making the average salary appear higher than what most employees actually earn. The median, however, is not affected by this unusually high salary. At €40,000, it gives us a different perspective on what a typical employee earns in PeopleTech Ltd. This is particularly useful for HR professionals because it helps us understand what employees typically earn, without the results being skewed by a small number of particularly high or low salaries. Neither figure is wrong. They simply tell us different things about how pay is distributed across the company. Looking at both together gives us a more complete picture than relying on either one alone. One thing to note: when there is an even number of employees, there won't be one person sitting exactly in the middle. In this case, we take the two middle salaries and calculate their average to find the median. How does this all relate to the EU Pay Transparency Directive? The EU Pay Transparency Directive requires employers to report on both the mean and median gender pay gap. These gaps are calculated by finding the average pay for male employees and the average pay for female employees, and then measuring the difference between them. The difference is expressed as a percentage of men's average pay. For example, a gender pay gap of +10% means that women's average pay is 10% lower than men's average pay. But why does the Directive want to look at both figures? The size of a company's mean gender pay gap and median gender pay gap can tell us different things about how pay is distributed across the organisation. If a company's mean gender pay gap is larger than its median gender pay gap, this could suggest that higher-paid employees are having a greater influence on the overall gap. Think back to our PeopleTech Ltd. example, where the CEO's €100,000 salary pulled the mean upwards. A similar effect could occur in an organisation where the pay gap between most male and female employees is relatively small, but a highly paid position, such as the CEO role, is occupied by a man. Even though the difference in pay across the wider workforce may be relatively modest, this one high salary could pull the mean upwards and result in a much larger overall gender pay gap. On the other hand, if a company's median gender pay gap is larger than its mean gender pay gap, this could suggest that the difference in pay is more evident across the wider workforce, rather than being driven primarily by a small number of highly or lower paid positions. In other words, the gap may be more noticeable among employees around the middle of the pay distribution, rather than being concentrated at the top. This could highlight wider differences in how men and women are paid across the organisation, and may warrant further investigation. It is important to remember that neither the mean nor the median tells us exactly why a gender pay gap exists. They are indicators that help us identify patterns and differences in pay, rather than explanations in themselves. By looking at both measures together, HR professionals can begin to build a clearer picture of pay within their organisation, identify areas that may need further investigation and take a more informed approach to understanding and addressing any gaps.

Read article

The information on this page is not intended to serve and does not serve as legal advice. All of the content, information, and material on this website are only for general informational use.

Copyright © 2026 SkillsTrust. All Rights Reserved.

The information on this page is not intended to serve and does not serve as legal advice. All of the content, information, and material on this website are only for general informational use.

Copyright © 2026 SkillsTrust. All Rights Reserved.

The information on this page is not intended to serve and does not serve as legal advice. All of the content, information, and material on this website are only for general informational use.

Copyright © 2026 SkillsTrust. All Rights Reserved.

The information on this page is not intended to serve and does not serve as legal advice. All of the content, information, and material on this website are only for general informational use.

Copyright © 2026 SkillsTrust. All Rights Reserved.