
The Anatomy of a Pay Gap: Key Drivers and How to Close It

SkillsTrust

• 4 minute read

When most people think of pay gaps, their minds jump to unequal pay for equal work. That’s understandable, as employment law cases often revolve around this issue. 

But here’s the thing: even in companies that ensure equal pay for equal work, pay gaps can still persist. Why? Because they’re driven by representation gaps at different job levels and across functions.

The core issue lies in who holds certain roles and how those roles are compensated. If you want to close the gender pay gap at your company, understanding these representation-related drivers is key.

Let’s break down the anatomy of a pay gap and explore specific steps your business can take to close it for good.

  1. Representation Gaps at Senior Levels

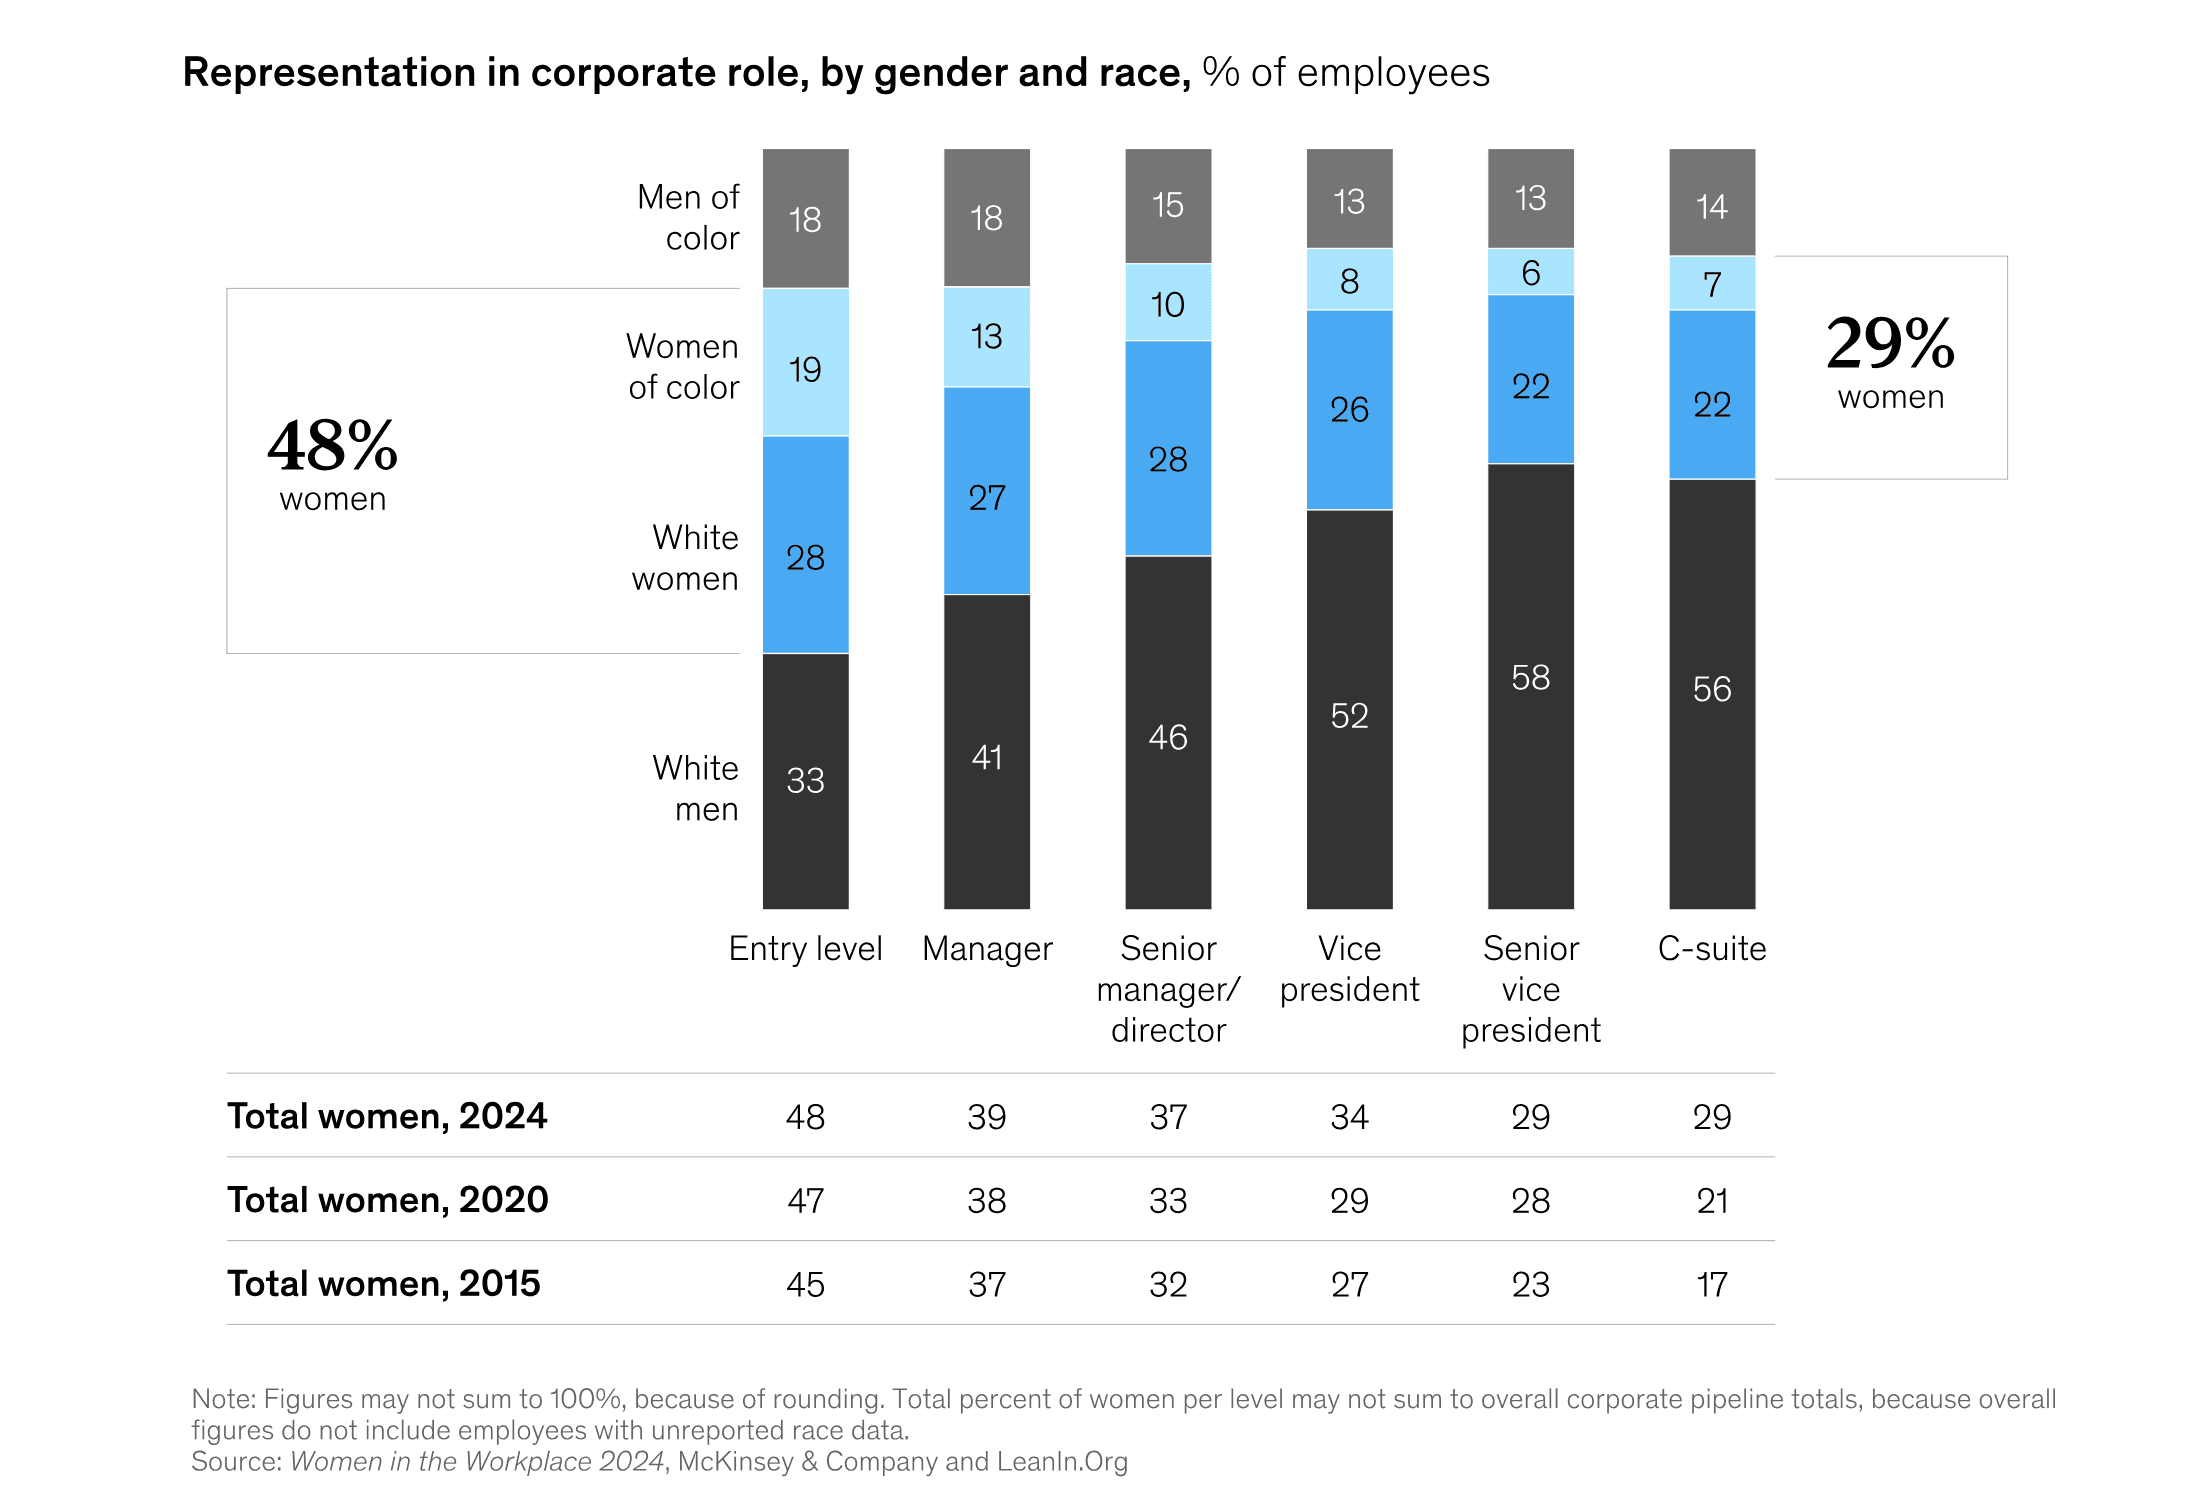
The problem. Pay gaps are often heavily influenced by an under-representation of women in higher-paying senior roles. Despite some progress at the C Suite level - in 2024 women make up 29% of C-suite positions versus 17% in 2015 - headway has been much slower at manager level of the pipeline. In fact, only 89 women were promoted to managerial roles for every 100 men in 2024. 

As you can see from the chart below, factor in ethnicity and the results are even worse. At the current rate of progress it will take 22 years for white women and 50 years for all women to achieve parity. 
Source: McKinsey

The solution:

  • Talent Reviews & Succession Planning: Conduct regular talent reviews and succession planning to ensure diverse talent is being developed and promoted at every level.

  • Representation Data Tracking: Measure and track representation data over time to identify and fix broken rungs on the corporate ladder.

  • Leadership Accountability: Ensure leaders at all levels are held accountable for substantive gender parity progress across the business.

  1. Occupational Segregation by Gender

The problem. Certain roles or industries are often gendered, with women more likely to work in lower-paid sectors - like caregiving or administrative work - with men in higher-paid technical fields. This is problematic for organisations as it contributes to the gender pay gap. 

In the US, even in fields where women hold the majority of jobs, women still tend to be paid less than men. And, in the UK, the Office for National Statistics (ONS) shows more women (10.5%) than men (7.2%) worked low-paid jobs in 2023.

Source: Annual Survey of Hours and Earnings (ASHE) from the Office for National Statistics

The solution:

  • Targeted Recruitment Strategies: Implement targeted recruitment strategies to diversify talent pools and ensure gender parity in interview pools for every role.

  • Gender-Neutral Job Descriptions: Remove gendered perceptions of roles by creating gender-neutral job descriptions that use pronouns like "they/their" instead of "he/she."

  • Fair Shift Payments: Ensure that higher rates for specific shifts (e.g., unsociable hours) are distributed equitably and do not favour men over women.

  1. The Part-time Work Penalty

The problem. Women are more likely to work part-time (28% of women work part-time versus 8% of men in the EU) or in flexible roles, often due to having the lions’ share of caring and housework responsibilities. In 2022, 60% of employed women with children in the EU worked part time. 

This leads to an hourly wage penalty of 20% for part-time workers in comparison to the full-time counterparts. Data from the ONS also shows that in the UK, 22% of part-time employees were low paid in comparison to 4.2% of full-time employees. 

The solution:

  • FTE-Based Pay Reviews: Ensure pay reviews are conducted based on full-time equivalent (FTE) salaries. This allows for fair comparison between full-time and part-time employees, ensuring that part-time roles are evaluated as if they were full-time for consistent pay equity.

  • Flexible Working Policies: Introduce or expand flexible working policies that are accessible to everyone and role-modelled at all organisational levels.

  • Training & Development for Part-Time Employees: Ensure part-time employees have access to, and are actively using, training and development opportunities to advance their careers.

  1. Bonuses and Incentives

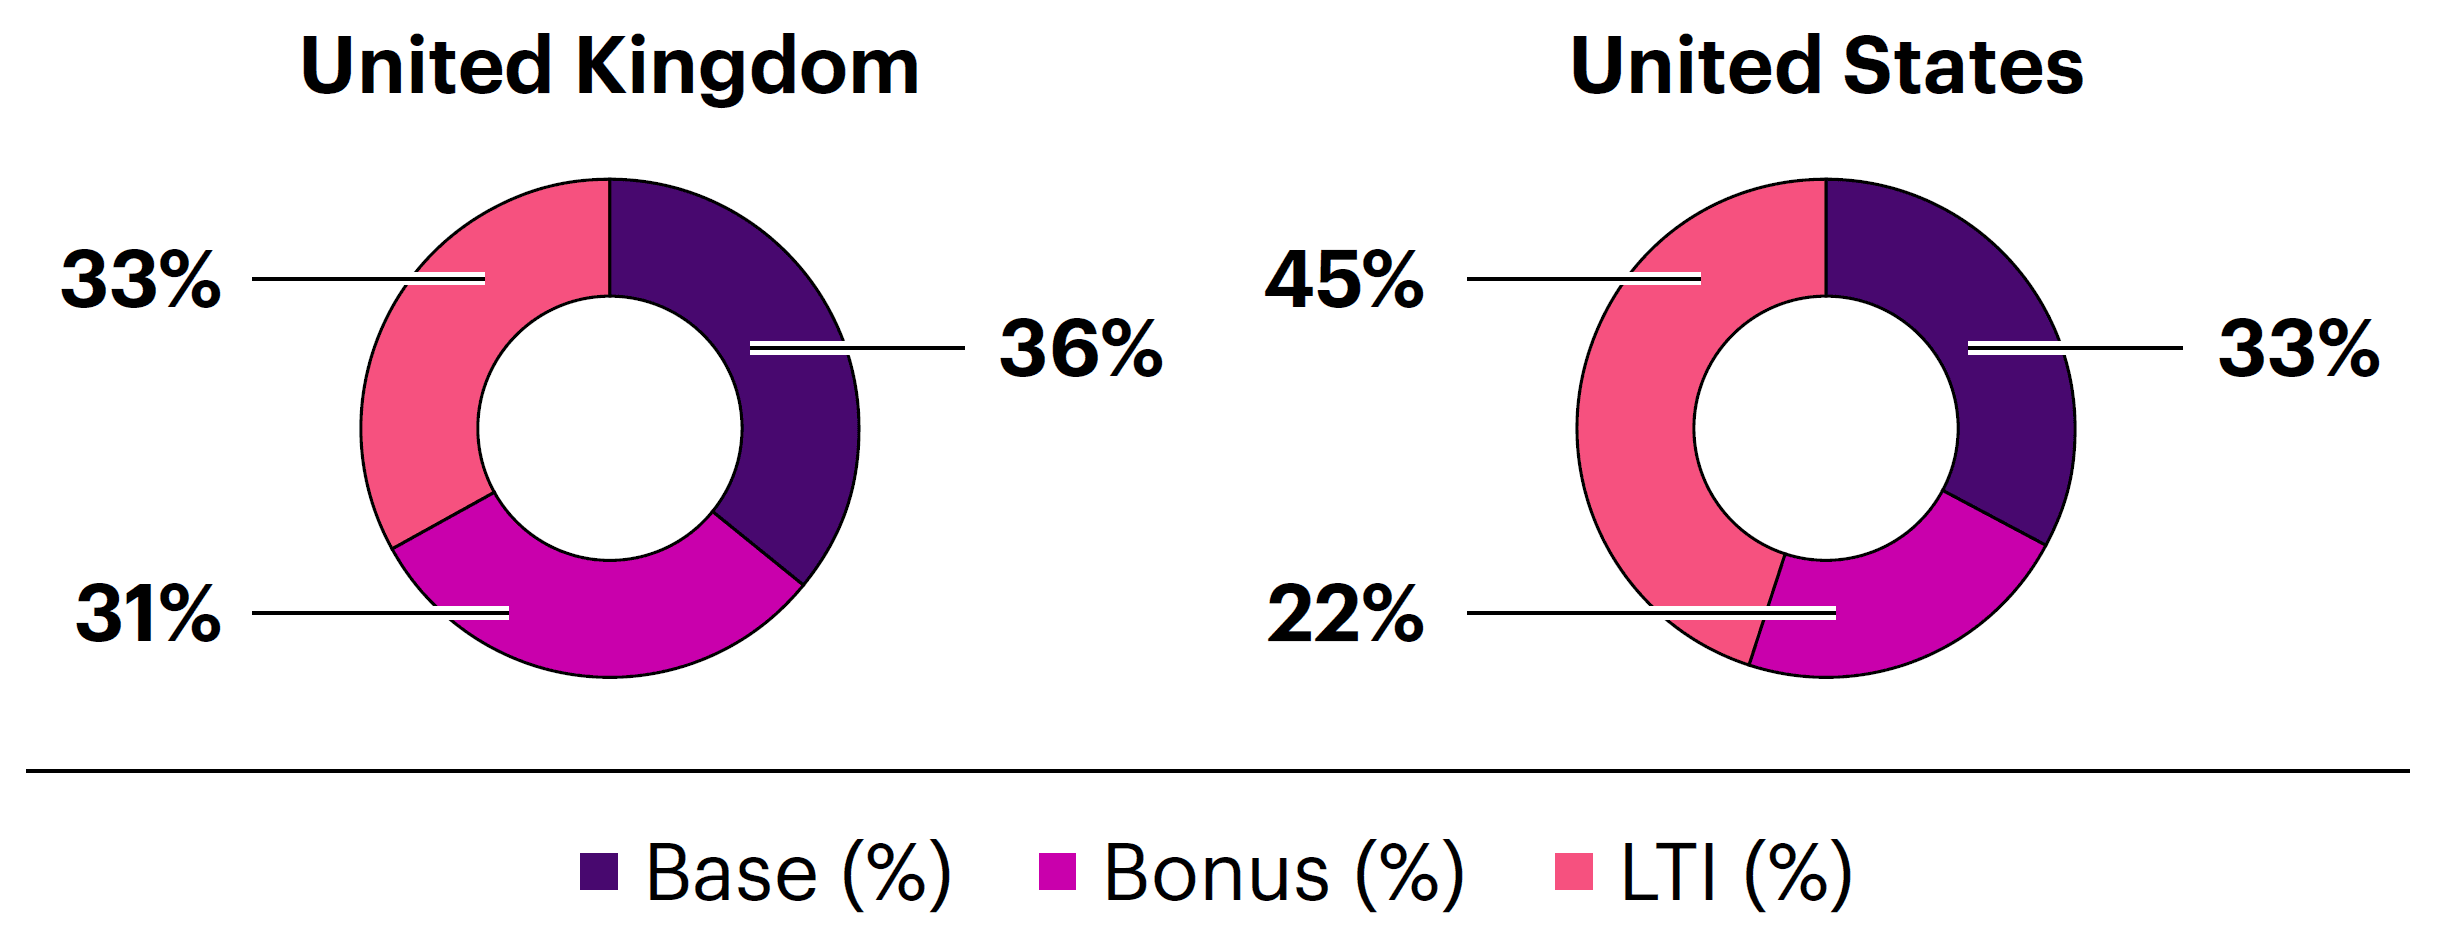
The problem. More senior roles, which are mostly occupied by men, typically attract higher bonuses and long-term incentives. This data from Willis Towers Watson shows the median pay mix for a CFO or top financial officer in 2023. With 200% of base pay accounted for by short and long-term bonuses, it’s easy to see how incentives significantly exacerbate the pay gap.
Source: 2023 Pay Trends in Executive Compensation, Willis Towers Watson

The solution:

Review and adjust bonus schemes to ensure they’re equitable across genders and job levels. This can be difficult due to the important role incentives play in attracting and retaining talent at different organisational levels. The key here is to get more women into senior roles that are eligible for high-value incentives. 

  1. Cultural and Structural Bias In Progression

The problem. Women can see the more senior roles they want to get to, but a glass ceiling - consisting of cultural and structural biases - stops them from getting there. Lean In is an organisation dedicated to helping women achieve their ambitions and creating an equal world. Their Women in the Workplace Report shows that women are just as ambitious as men. Yet, despite an increase in female representation in senior roles, women’s day-to-day experiences largely reflect those of a decade ago. For example, women are far more likely than men to deal with comments and actions that undermine their skills and expertise. 

The solution:

There are lots of different angles to attack this issue from, including:

  • Boosting Allyship - this involves people in positions of privilege and power - including senior leaders - to actively and consistently support and advocate for those with less privilege.

  • Tackling bias - training plays a vital role in tackling conscious and unconscious bias. Take a look at the presentation materials available from Lean In. You can also send bias reminders before performance, pay and development reviews to nudge managers about the importance of taking a non-biased approach. 

  • Creating Networks - when companies bring women together in small groups to talk about their experiences, build skills, share advice and celebrate each other’s wins, 73% of participants feel equipped to be better leaders.

  • Mentoring and Sponsorship - this doesn’t have to mean being sponsored or mentored by someone on the executive team to develop the skills and networks needed for more senior roles. Explore the idea of connecting women with someone in an appropriate role at the next organisational level. 

  • Equality Impact Assessments - if you’re thinking of changing your HR policies, ensure they don’t contain structural biases. For example, consider your benefits policies through an equity lens and you might find that providing unequal benefits - like more maternity than paternity pay - are contributing to long-term inequalities. Research shows that making mothers the de facto caregiver from birth causes more women than men to reduce their hours, work flexibly, forgo training opportunities or move to a less intensive role. Mothers are also twice as likely as fathers to report childcare availability as having a big impact on their ability to work. 

  1. Intervention Tracking and Accountability

The problem. Without data, visibility and accountability, inequality initiatives falter.

The solution:

  • Set Clear Goals: Define clear, measurable goals for gender equity and pay parity. Track progress over time, and ensure leadership is held accountable for achieving these goals.

  • Pay Transparency: Implement pay transparency policies, so employees understand how pay decisions are made and how to progress.

Final Thoughts: Closing The Pay Gap

By addressing the elements in this article, you can identify the underlying causes of gender pay inequalities. Which is the first step towards implementing the interventions that will smash the glass ceiling and close the gap. 

Pay equity is a key factor in ensuring your business is ready for the EU’s Pay Transparency Directive. Take a look at our pay transparency readiness checklist to identify any potential risks before the 2026 deadline and see how ready your business is for the upcoming legislation.

Read more articles

Michelle Dervan

2 Nov 2026

All About Averages | Pay Analytics 101

The Importance of the Average When talking about pay data, the term average appears time and time again, but what does it actually mean? Put simply, an average salary gives us one figure to help describe pay across a group of employees. It takes all the salary values from that group and calculates a figure that would represent a ‘typical’ employee in that group. This is useful because it allows us to compare pay between different employee groups without having to look at every individual salary. The average can become an even more powerful metric when we begin to understand and analyse the different ways it’s calculated. It might seem counterintuitive that a figure like the average can be calculated in different ways and possibly provide different answers. After all, how can the same set of salaries produce different averages? The key is that each method looks at the data differently, helping us bring a different part of the picture into focus. There are two types of average that are particularly important when it comes to understanding pay: the mean and the median. So, how do they work, and what can each tell us about pay? Let's introduce them using a simple example company, PeopleTech Ltd. The Mean: What would everyone earn if pay were shared equally? The mean is what many people think of when they hear the word average. It shows us what each employee would earn if the company's total pay were shared equally among everyone. In everyday conversation, the terms mean and average are often used interchangeably. However, this isn't technically accurate, as the mean is just one of the ways to calculate an average, as we'll explore later on. To calculate the mean, we simply add together all the salaries and divide the total by the number of employees. Let's look at the example company, PeopleTech Ltd. Imagine the five employees earn the following annual salaries: €30,000 + €40,000 + €40,000 + €50,000 + €100,000 = €260,000 PeopleTech Ltd. has a total annual salary bill of €260,000 across its five employees. To calculate the mean, we divide this total by five: €260,000 ÷ 5 = €52,000 So, the mean salary at PeopleTech Ltd. is €52,000. In other words, if the company's total salary bill were shared equally between all five employees, each person would receive €52,000. The mean is useful because it gives us an overall picture of pay across the company. However, as we'll see, it doesn't always reflect what most employees actually earn, particularly when there are significant differences between the highest and lowest salaries. The Median: What is the salary in the middle? But what happens when one or two employees earn significantly more than everyone else? This is where the median can give us a different perspective. While the mean looks at the total of all salaries, the median looks directly at the middle of the data. Imagine arranging all our employees in a straight line, from the lowest-paid to the highest-paid. The salary of the person standing in the middle would represent our median salary. Let's look at PeopleTech Ltd. again. Using the same salaries as before, we arrange them from lowest to highest: €30,000 | €40,000 | €40,000 | €50,000 | €100,000 The middle salary is €40,000, making this the median salary for PeopleTech Ltd. What makes the median particularly useful is that it is not affected by unusually high or low salaries, often referred to as outliers. In our example, let's assume the €100,000 salary belongs to the CEO, which is double the next highest salary. This unusually high salary pulls the mean upwards, making the average salary appear higher than what most employees actually earn. The median, however, is not affected by this unusually high salary. At €40,000, it gives us a different perspective on what a typical employee earns in PeopleTech Ltd. This is particularly useful for HR professionals because it helps us understand what employees typically earn, without the results being skewed by a small number of particularly high or low salaries. Neither figure is wrong. They simply tell us different things about how pay is distributed across the company. Looking at both together gives us a more complete picture than relying on either one alone. One thing to note: when there is an even number of employees, there won't be one person sitting exactly in the middle. In this case, we take the two middle salaries and calculate their average to find the median. How does this all relate to the EU Pay Transparency Directive? The EU Pay Transparency Directive requires employers to report on both the mean and median gender pay gap. These gaps are calculated by finding the average pay for male employees and the average pay for female employees, and then measuring the difference between them. The difference is expressed as a percentage of men's average pay. For example, a gender pay gap of +10% means that women's average pay is 10% lower than men's average pay. But why does the Directive want to look at both figures? The size of a company's mean gender pay gap and median gender pay gap can tell us different things about how pay is distributed across the organisation. If a company's mean gender pay gap is larger than its median gender pay gap, this could suggest that higher-paid employees are having a greater influence on the overall gap. Think back to our PeopleTech Ltd. example, where the CEO's €100,000 salary pulled the mean upwards. A similar effect could occur in an organisation where the pay gap between most male and female employees is relatively small, but a highly paid position, such as the CEO role, is occupied by a man. Even though the difference in pay across the wider workforce may be relatively modest, this one high salary could pull the mean upwards and result in a much larger overall gender pay gap. On the other hand, if a company's median gender pay gap is larger than its mean gender pay gap, this could suggest that the difference in pay is more evident across the wider workforce, rather than being driven primarily by a small number of highly or lower paid positions. In other words, the gap may be more noticeable among employees around the middle of the pay distribution, rather than being concentrated at the top. This could highlight wider differences in how men and women are paid across the organisation, and may warrant further investigation. It is important to remember that neither the mean nor the median tells us exactly why a gender pay gap exists. They are indicators that help us identify patterns and differences in pay, rather than explanations in themselves. By looking at both measures together, HR professionals can begin to build a clearer picture of pay within their organisation, identify areas that may need further investigation and take a more informed approach to understanding and addressing any gaps.

Read article

The information on this page is not intended to serve and does not serve as legal advice. All of the content, information, and material on this website are only for general informational use.

Copyright © 2026 SkillsTrust. All Rights Reserved.

The information on this page is not intended to serve and does not serve as legal advice. All of the content, information, and material on this website are only for general informational use.

Copyright © 2026 SkillsTrust. All Rights Reserved.

The information on this page is not intended to serve and does not serve as legal advice. All of the content, information, and material on this website are only for general informational use.

Copyright © 2026 SkillsTrust. All Rights Reserved.

The information on this page is not intended to serve and does not serve as legal advice. All of the content, information, and material on this website are only for general informational use.

Copyright © 2026 SkillsTrust. All Rights Reserved.