

How should I train my managers for EU Pay Transparency?

SkillsTrust Team

• 4 minute read

With pay transparency preparations well under way, one of the most pressing questions HR teams have is how do I train and communicate with my managers about the upcoming changes.

Managers are our front line implementers of company policies, so it’s really important that they feel supported and knowledgeable about the new changes pay transparency will bring.

Back in October, we invited Begüm Bengi Kazak, Global Rewards Leader who has led 2 pay transparency roll-outs over her career, to speak with HR managers about this exact topic. 

We’ve collated the key takeaways from Begüm’s Q&A, as well as the training frameworks SkillsTrust has developed to give you a roadmap for manager training in your organisation. 

The Role of Managers in EU Pay Transparency

Before we can dive into designing the training content for managers, it’s important to understand what the role of managers is in relation to pay transparency. 

Managers are responsible for 3 key processes which relate to pay transparency:

  1. Hiring: Running recruitment processes

  2. Pay Decisions: Making pay and promotion decisions

  3. Employee Communications: Communicating pay information and fielding employee questions 

These are frontline processes, and so it’s crucial that managers understand what they need to know, what is changing, and how to be good ambassadors for your company’s pay transparency efforts. 
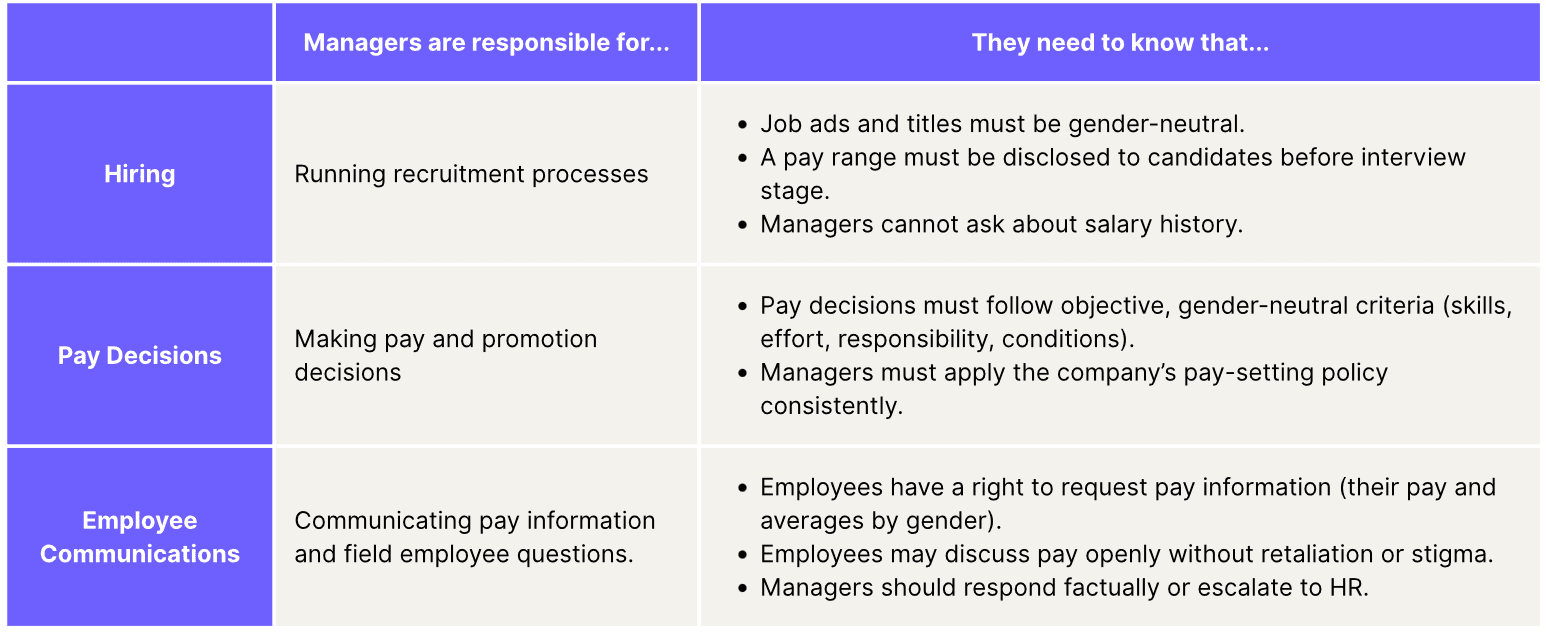
Key transparency obligations that managers are responsible for

Types of Training

Based on our experience, there are 3 layers of knowledge that managers need to build ahead of pay transparency: 

  1. Foundational knowledge: What every people manager in the EU should know regardless of which company they work for

  2. Organisational knowledge: How we approach pay transparency in this company from a policy perspective

  3. Situational knowledge: How we want you to put this into practice here (what to do when X happens)
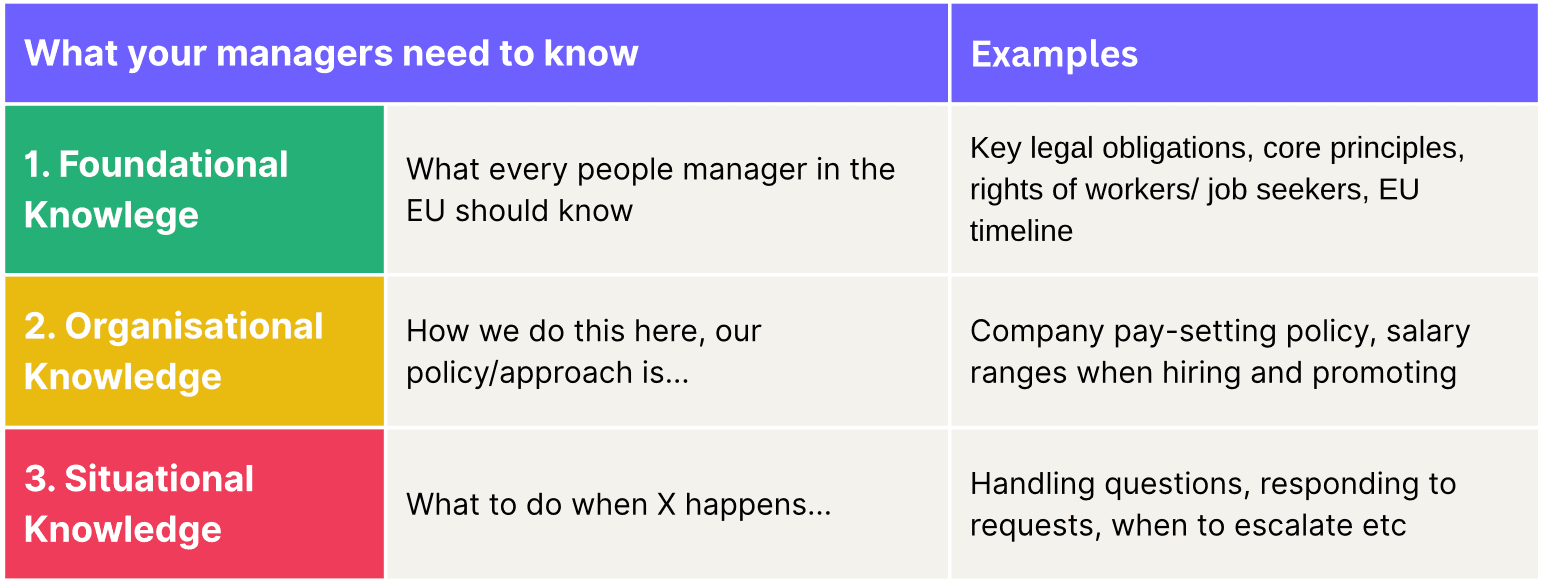
Manager Knowledge Framework

Foundational Knowledge

Every company can start  building foundational knowledge right now. The main goal should be that managers can explain the Directive, describe key obligations, and recognise situations where compliance matters. 

This can be general, but content should be localised as national laws are finalised. 

This content lends itself well to short micro-learning videos, docs & blogs. An example piece could be: “What the EU Pay Transparency Directive Means for You.”

Perform knowledge checks through quizzes to confirm the level of understanding amongst managers.
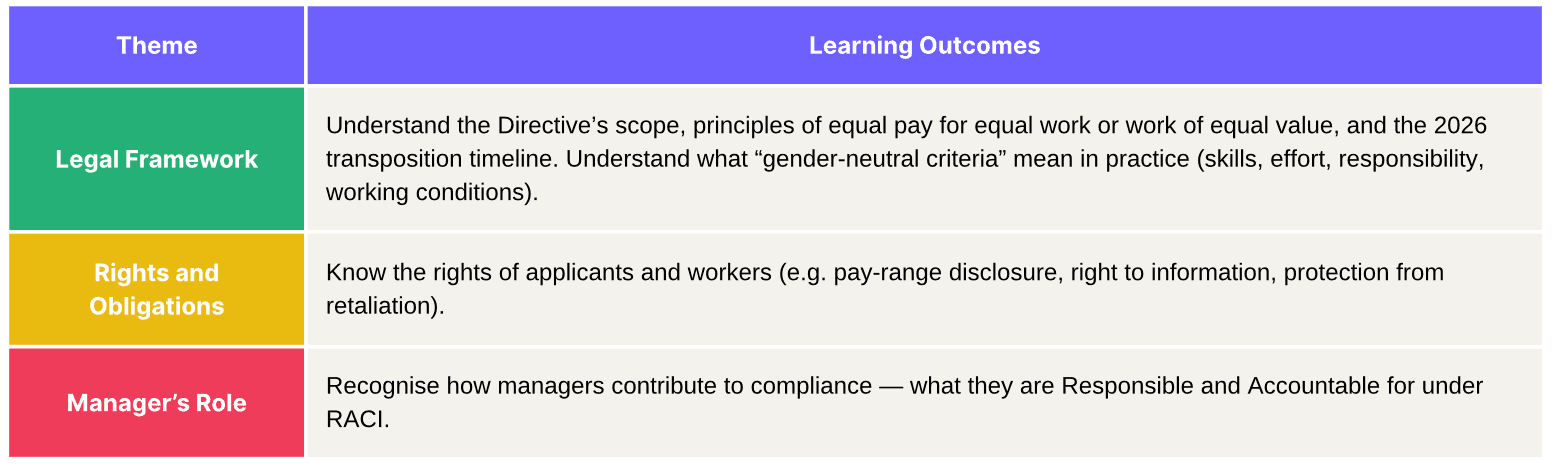
Foundational Knowledge learning outcomes

Organisational Knowledge

Organisational Knowledge details how your company implements pay transparency. This content is more time consuming to prepare, as it involves foundational work to have confidence in your job categories, salary ranges, progression & pay setting policy. The outcome should be that managers can apply internal rules consistently.

Once a solid pay-setting policy is in place:

  • Explain your internal pay-setting and progression policies.

  • Clarify how pay is determined e.g. by job level & family, geography, experience level, performance.

  • Align HR, Legal and Comms messaging before rollout.

Begüm advises that your pay-setting approach should be rooted in your company’s principles. It is less important to develop the ‘perfect methodology’ and more important that employees see the approach as being consistently applied across the organisation. Work with communications teams to develop simple material, videos, FAQs, docs etc. and tie all content back to your company’s principles

You can organise HR-led workshops or “how we pay” clinics and develop a quick-reference manager playbook (policies, FAQs, pay calculator for hiring).
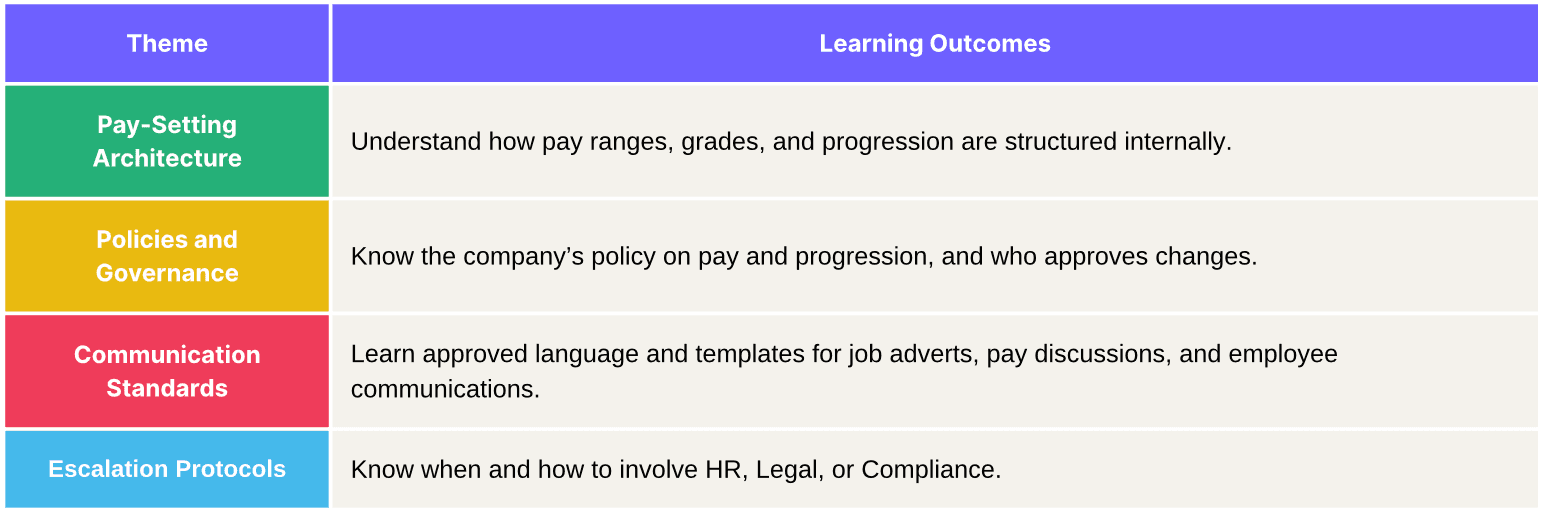
Organisational Knowledge Learning outcomes

Situational Knowledge

Building situational knowledge prepares managers for the real conversations and scenarios they’ll encounter once pay transparency is rolled out. These situations are crucial for the adoption and understanding of your company’s pay transparency implementation, so making sure managers feel confident to answer questions and follow protocols is essential. 

The outcome of this training should be that managers can demonstrate the ability to put pay transparency practices into action under pressure and role-model fairness in everyday interactions with employees.

Given the nuance, this topic lends itself to more hands-on training formats such as scenario-based simulations or role plays. Short micro-learning videos such as  “How to respond to a pay transparency question” are also helpful resources to go back to. You may also want to conduct some coaching or manager round-tables to debrief real cases.

You shouldn’t dive into situational knowledge training until managers feel confident in their foundational & organisational knowledge. 
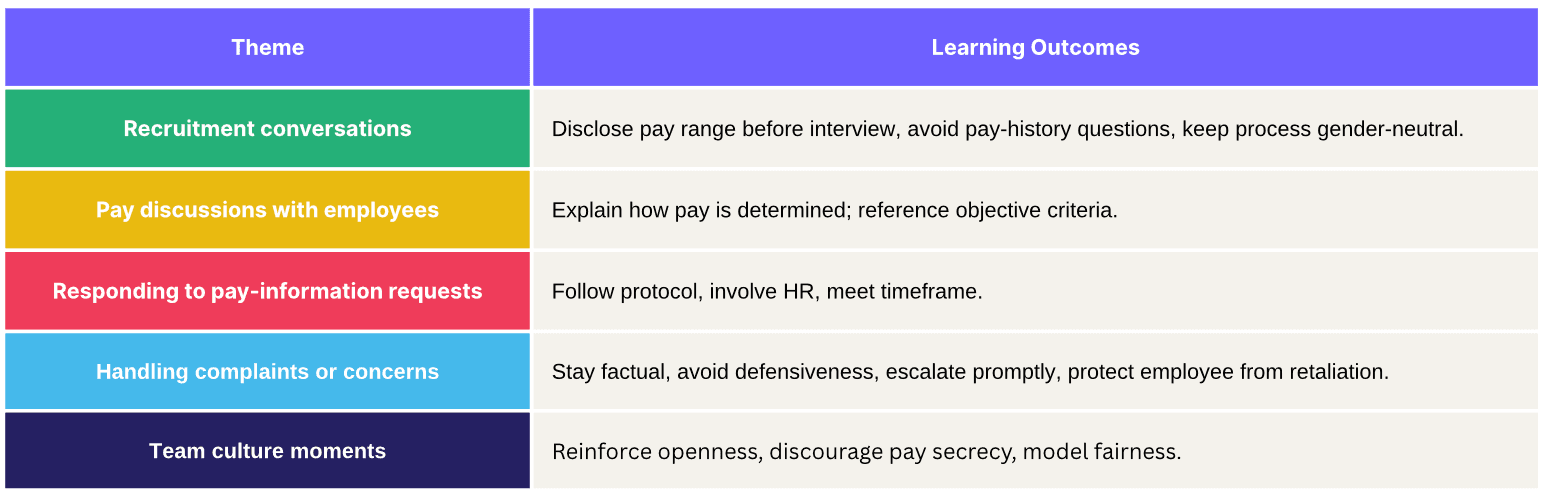
Situational Knowledge Learning outcomes

Pay transparency can feel like a big topic, but once broken down to 3 simple knowledge pillars, it’s much easier to build a curriculum that feels manageable and easy to digest. 

As Begüm reminded us, every organization has a foundation to build on. No one is truly starting from scratch when it comes to pay transparency. By grounding new changes in the core pillars of your company culture, you can create a smoother transition into this new era of pay transparency.

Huge thanks to Begüm for sharing her wisdom. 

SkillsTrust provides tools and services that make pay transparency simple for EU employers. To learn more, book a free call.

Read more articles

Michelle Dervan

2 Nov 2026

All About Averages | Pay Analytics 101

The Importance of the Average When talking about pay data, the term average appears time and time again, but what does it actually mean? Put simply, an average salary gives us one figure to help describe pay across a group of employees. It takes all the salary values from that group and calculates a figure that would represent a ‘typical’ employee in that group. This is useful because it allows us to compare pay between different employee groups without having to look at every individual salary. The average can become an even more powerful metric when we begin to understand and analyse the different ways it’s calculated. It might seem counterintuitive that a figure like the average can be calculated in different ways and possibly provide different answers. After all, how can the same set of salaries produce different averages? The key is that each method looks at the data differently, helping us bring a different part of the picture into focus. There are two types of average that are particularly important when it comes to understanding pay: the mean and the median. So, how do they work, and what can each tell us about pay? Let's introduce them using a simple example company, PeopleTech Ltd. The Mean: What would everyone earn if pay were shared equally? The mean is what many people think of when they hear the word average. It shows us what each employee would earn if the company's total pay were shared equally among everyone. In everyday conversation, the terms mean and average are often used interchangeably. However, this isn't technically accurate, as the mean is just one of the ways to calculate an average, as we'll explore later on. To calculate the mean, we simply add together all the salaries and divide the total by the number of employees. Let's look at the example company, PeopleTech Ltd. Imagine the five employees earn the following annual salaries: €30,000 + €40,000 + €40,000 + €50,000 + €100,000 = €260,000 PeopleTech Ltd. has a total annual salary bill of €260,000 across its five employees. To calculate the mean, we divide this total by five: €260,000 ÷ 5 = €52,000 So, the mean salary at PeopleTech Ltd. is €52,000. In other words, if the company's total salary bill were shared equally between all five employees, each person would receive €52,000. The mean is useful because it gives us an overall picture of pay across the company. However, as we'll see, it doesn't always reflect what most employees actually earn, particularly when there are significant differences between the highest and lowest salaries. The Median: What is the salary in the middle? But what happens when one or two employees earn significantly more than everyone else? This is where the median can give us a different perspective. While the mean looks at the total of all salaries, the median looks directly at the middle of the data. Imagine arranging all our employees in a straight line, from the lowest-paid to the highest-paid. The salary of the person standing in the middle would represent our median salary. Let's look at PeopleTech Ltd. again. Using the same salaries as before, we arrange them from lowest to highest: €30,000 | €40,000 | €40,000 | €50,000 | €100,000 The middle salary is €40,000, making this the median salary for PeopleTech Ltd. What makes the median particularly useful is that it is not affected by unusually high or low salaries, often referred to as outliers. In our example, let's assume the €100,000 salary belongs to the CEO, which is double the next highest salary. This unusually high salary pulls the mean upwards, making the average salary appear higher than what most employees actually earn. The median, however, is not affected by this unusually high salary. At €40,000, it gives us a different perspective on what a typical employee earns in PeopleTech Ltd. This is particularly useful for HR professionals because it helps us understand what employees typically earn, without the results being skewed by a small number of particularly high or low salaries. Neither figure is wrong. They simply tell us different things about how pay is distributed across the company. Looking at both together gives us a more complete picture than relying on either one alone. One thing to note: when there is an even number of employees, there won't be one person sitting exactly in the middle. In this case, we take the two middle salaries and calculate their average to find the median. How does this all relate to the EU Pay Transparency Directive? The EU Pay Transparency Directive requires employers to report on both the mean and median gender pay gap. These gaps are calculated by finding the average pay for male employees and the average pay for female employees, and then measuring the difference between them. The difference is expressed as a percentage of men's average pay. For example, a gender pay gap of +10% means that women's average pay is 10% lower than men's average pay. But why does the Directive want to look at both figures? The size of a company's mean gender pay gap and median gender pay gap can tell us different things about how pay is distributed across the organisation. If a company's mean gender pay gap is larger than its median gender pay gap, this could suggest that higher-paid employees are having a greater influence on the overall gap. Think back to our PeopleTech Ltd. example, where the CEO's €100,000 salary pulled the mean upwards. A similar effect could occur in an organisation where the pay gap between most male and female employees is relatively small, but a highly paid position, such as the CEO role, is occupied by a man. Even though the difference in pay across the wider workforce may be relatively modest, this one high salary could pull the mean upwards and result in a much larger overall gender pay gap. On the other hand, if a company's median gender pay gap is larger than its mean gender pay gap, this could suggest that the difference in pay is more evident across the wider workforce, rather than being driven primarily by a small number of highly or lower paid positions. In other words, the gap may be more noticeable among employees around the middle of the pay distribution, rather than being concentrated at the top. This could highlight wider differences in how men and women are paid across the organisation, and may warrant further investigation. It is important to remember that neither the mean nor the median tells us exactly why a gender pay gap exists. They are indicators that help us identify patterns and differences in pay, rather than explanations in themselves. By looking at both measures together, HR professionals can begin to build a clearer picture of pay within their organisation, identify areas that may need further investigation and take a more informed approach to understanding and addressing any gaps.

Read article

Michelle Dervan

2 Nov 2026

All About Averages | Pay Analytics 101

The Importance of the Average When talking about pay data, the term average appears time and time again, but what does it actually mean? Put simply, an average salary gives us one figure to help describe pay across a group of employees. It takes all the salary values from that group and calculates a figure that would represent a ‘typical’ employee in that group. This is useful because it allows us to compare pay between different employee groups without having to look at every individual salary. The average can become an even more powerful metric when we begin to understand and analyse the different ways it’s calculated. It might seem counterintuitive that a figure like the average can be calculated in different ways and possibly provide different answers. After all, how can the same set of salaries produce different averages? The key is that each method looks at the data differently, helping us bring a different part of the picture into focus. There are two types of average that are particularly important when it comes to understanding pay: the mean and the median. So, how do they work, and what can each tell us about pay? Let's introduce them using a simple example company, PeopleTech Ltd. The Mean: What would everyone earn if pay were shared equally? The mean is what many people think of when they hear the word average. It shows us what each employee would earn if the company's total pay were shared equally among everyone. In everyday conversation, the terms mean and average are often used interchangeably. However, this isn't technically accurate, as the mean is just one of the ways to calculate an average, as we'll explore later on. To calculate the mean, we simply add together all the salaries and divide the total by the number of employees. Let's look at the example company, PeopleTech Ltd. Imagine the five employees earn the following annual salaries: €30,000 + €40,000 + €40,000 + €50,000 + €100,000 = €260,000 PeopleTech Ltd. has a total annual salary bill of €260,000 across its five employees. To calculate the mean, we divide this total by five: €260,000 ÷ 5 = €52,000 So, the mean salary at PeopleTech Ltd. is €52,000. In other words, if the company's total salary bill were shared equally between all five employees, each person would receive €52,000. The mean is useful because it gives us an overall picture of pay across the company. However, as we'll see, it doesn't always reflect what most employees actually earn, particularly when there are significant differences between the highest and lowest salaries. The Median: What is the salary in the middle? But what happens when one or two employees earn significantly more than everyone else? This is where the median can give us a different perspective. While the mean looks at the total of all salaries, the median looks directly at the middle of the data. Imagine arranging all our employees in a straight line, from the lowest-paid to the highest-paid. The salary of the person standing in the middle would represent our median salary. Let's look at PeopleTech Ltd. again. Using the same salaries as before, we arrange them from lowest to highest: €30,000 | €40,000 | €40,000 | €50,000 | €100,000 The middle salary is €40,000, making this the median salary for PeopleTech Ltd. What makes the median particularly useful is that it is not affected by unusually high or low salaries, often referred to as outliers. In our example, let's assume the €100,000 salary belongs to the CEO, which is double the next highest salary. This unusually high salary pulls the mean upwards, making the average salary appear higher than what most employees actually earn. The median, however, is not affected by this unusually high salary. At €40,000, it gives us a different perspective on what a typical employee earns in PeopleTech Ltd. This is particularly useful for HR professionals because it helps us understand what employees typically earn, without the results being skewed by a small number of particularly high or low salaries. Neither figure is wrong. They simply tell us different things about how pay is distributed across the company. Looking at both together gives us a more complete picture than relying on either one alone. One thing to note: when there is an even number of employees, there won't be one person sitting exactly in the middle. In this case, we take the two middle salaries and calculate their average to find the median. How does this all relate to the EU Pay Transparency Directive? The EU Pay Transparency Directive requires employers to report on both the mean and median gender pay gap. These gaps are calculated by finding the average pay for male employees and the average pay for female employees, and then measuring the difference between them. The difference is expressed as a percentage of men's average pay. For example, a gender pay gap of +10% means that women's average pay is 10% lower than men's average pay. But why does the Directive want to look at both figures? The size of a company's mean gender pay gap and median gender pay gap can tell us different things about how pay is distributed across the organisation. If a company's mean gender pay gap is larger than its median gender pay gap, this could suggest that higher-paid employees are having a greater influence on the overall gap. Think back to our PeopleTech Ltd. example, where the CEO's €100,000 salary pulled the mean upwards. A similar effect could occur in an organisation where the pay gap between most male and female employees is relatively small, but a highly paid position, such as the CEO role, is occupied by a man. Even though the difference in pay across the wider workforce may be relatively modest, this one high salary could pull the mean upwards and result in a much larger overall gender pay gap. On the other hand, if a company's median gender pay gap is larger than its mean gender pay gap, this could suggest that the difference in pay is more evident across the wider workforce, rather than being driven primarily by a small number of highly or lower paid positions. In other words, the gap may be more noticeable among employees around the middle of the pay distribution, rather than being concentrated at the top. This could highlight wider differences in how men and women are paid across the organisation, and may warrant further investigation. It is important to remember that neither the mean nor the median tells us exactly why a gender pay gap exists. They are indicators that help us identify patterns and differences in pay, rather than explanations in themselves. By looking at both measures together, HR professionals can begin to build a clearer picture of pay within their organisation, identify areas that may need further investigation and take a more informed approach to understanding and addressing any gaps.

Read article

The information on this page is not intended to serve and does not serve as legal advice. All of the content, information, and material on this website are only for general informational use.

Copyright © 2026 SkillsTrust. All Rights Reserved.

The information on this page is not intended to serve and does not serve as legal advice. All of the content, information, and material on this website are only for general informational use.

Copyright © 2026 SkillsTrust. All Rights Reserved.

The information on this page is not intended to serve and does not serve as legal advice. All of the content, information, and material on this website are only for general informational use.

Copyright © 2026 SkillsTrust. All Rights Reserved.

The information on this page is not intended to serve and does not serve as legal advice. All of the content, information, and material on this website are only for general informational use.

Copyright © 2026 SkillsTrust. All Rights Reserved.