


One Month to Go: The EU Pay Transparency Directive Deadline Is Almost Here

Olwyn Patterson

• 4 minute read

In 2023, EU Member States voted on, and passed, the EU Pay Transparency Directive. 7 June 2026 was the date chosen for each Member State to transpose the legislation locally. And now, with one month to go, the picture looks less like a coordinated legal rollout and more like a class of college students scrambling to meet a deadline.

One has handed in on time. A few have partial submissions. One is openly weighing up whether it would rather take the penalty than complete the assignment. The rest of the class appears to be asking for extensions.
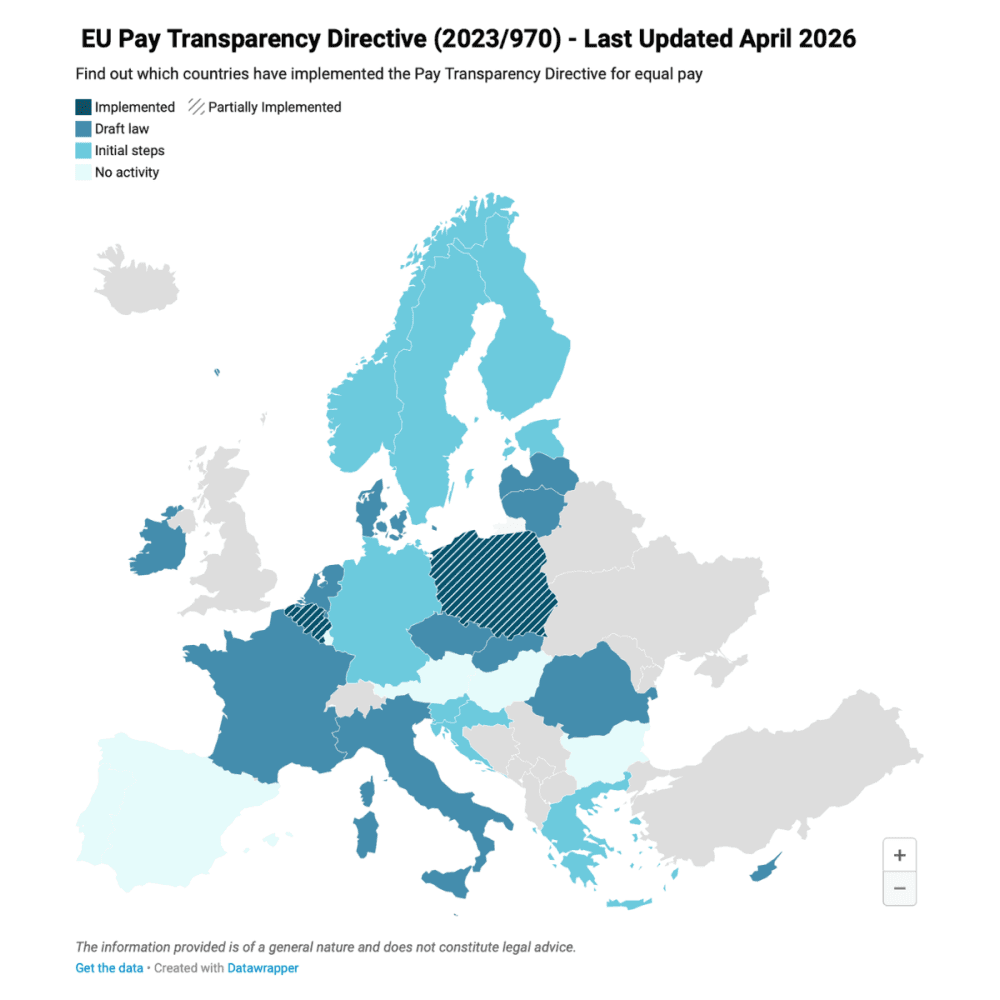
Article content

Source: Lewis Silkin EU Pay Transparency Directive Tracker

Even the law that has been transposed on time came at the eleventh hour. Slovakia, the only country so far to fully transpose the Directive into national law, adopted its Equal Pay Act on 15 April 2026, with the law coming into force on 7 June 2026. That gives employers less than eight weeks between adoption and commencement to get ready.

While we can complain about policymakers dragging their feet for the last three years, businesses should not feel paralysed by the fact that national legislation is still missing in many jurisdictions. The myth about the Directive that I believe commentators often get wrong is that this is a brand-new challenge for companies.

Yes, enforced pay transparency is a seismic shift for many employers. But the “net-new” part is the enforcement. The principles underneath it have been sitting in plain sight for decades. Article 4 requires pay structures that allow employers to assess whether workers are in a comparable situation, using objective, gender-neutral criteria including skills, effort, responsibility and working conditions. Translated out of legalese, that means having a defensible job architecture in place. Formal job evaluation has been around for a century. Merrill R. Lott introduced point-factor job evaluation in 1925, before expanding the idea in Wage Scales and Job Evaluation in 1926.

Another “not entirely new” requirement is the Article 7 right to information. While the content is now related to pay, EU companies have been handling GDPR subject access requests since 2018. The muscle memory is there: receive a request, identify the relevant data, apply a deadline, respond clearly and document the process. The Directive changes the subject matter, not the basic discipline.

In fact, an indicator of how “not new” the EU Pay Transparency Directive is comes, surprisingly, from some of its critics.

Sweden has called for renegotiation and simplification of the Directive. Estonia has also pushed back, with its economic affairs minister reportedly saying the country would rather pay a fine than increase the administrative burden on businesses.

The reasons are not identical. Estonia’s objection has been framed around bureaucracy and business competitiveness. Sweden’s position is more nuanced: it argues the Directive is too administratively burdensome in its current form and should be simplified. But Sweden is also starting from a different place. Through collective bargaining, the Swedish Discrimination Act and annual equal pay survey obligations, Swedish employers already operate within a more developed framework for discussing, documenting and assessing pay equality. These systems may not have been called “pay transparency” until now, but they have already given employers, employees and social partners a structure for engaging with pay.

And yet, even progressive countries still have work to do. Sweden remains one of Europe’s most progressive countries on pay equity reporting, but its national gender pay gap has not disappeared, sitting at 11%.

So, for companies waiting with bated breath for national transposition, what can you do in the meantime?

The answer is less dramatic than you might hope: get the basics together.

National legislation will hopefully give more detail on which specific pay components to include, local reporting formats, worker representative consultation, enforcement mechanisms and penalties. But there is already more than enough context in the Directive itself to begin preparing.

There is also now practical guidance. The European Commission and the European Institute for Gender Equality have published updated EU-wide guidelines on gender-neutral job evaluation and classification. The guidance lays out job evaluation frameworks for micro-organisations, small and medium businesses and large organisations, which employers can begin to implement right away.

In other words: employers do not need to wait for every national parliament to finish its homework before starting their own.

I think the real anxiety comes from the procrastination of not starting. The longer employers wait to begin their pay transparency projects, the longer they can avoid thinking about the proliferated job titles, inconsistent salary histories, legacy pay agreements and “we’ve just always done it this way” decisions they will eventually have to face.

Pay transparency projects are a heavy lift, especially for small and medium-sized employers that do not have in-house compensation, legal and people analytics teams. But the work does not disappear if you ignore it. It simply waits.

The good news is that once you get visibility over your company’s state of pay, the problem becomes much less mysterious. You can see what needs documenting, what needs explaining, what needs consultation and what is already fair and equitable as it is.

That last point is what really matters. Pay transparency preparation is not only about uncovering risk. It is also about giving employers confidence where their practices are already sound.

With one month to go until the EU Pay Transparency Directive transposition deadline, it’s clear that not every Member State will be ready on time. Employers should be focusing on their own readiness instead.

Because whatever happens in national parliaments over the next few weeks, the direction of travel is now clear. Pay transparency is not a future trend. It is the next compliance baseline. And the employers that start with job architecture, gender-neutral evaluation and pay equity analysis now will be in a far better position than those waiting for the bell to ring.

Olwyn Patterson leads Operations at SkillsTrust, the simple pay transparency software for EU employers.

Read more articles

Michelle Dervan

2 Nov 2026

All About Averages | Pay Analytics 101

The Importance of the Average When talking about pay data, the term average appears time and time again, but what does it actually mean? Put simply, an average salary gives us one figure to help describe pay across a group of employees. It takes all the salary values from that group and calculates a figure that would represent a ‘typical’ employee in that group. This is useful because it allows us to compare pay between different employee groups without having to look at every individual salary. The average can become an even more powerful metric when we begin to understand and analyse the different ways it’s calculated. It might seem counterintuitive that a figure like the average can be calculated in different ways and possibly provide different answers. After all, how can the same set of salaries produce different averages? The key is that each method looks at the data differently, helping us bring a different part of the picture into focus. There are two types of average that are particularly important when it comes to understanding pay: the mean and the median. So, how do they work, and what can each tell us about pay? Let's introduce them using a simple example company, PeopleTech Ltd. The Mean: What would everyone earn if pay were shared equally? The mean is what many people think of when they hear the word average. It shows us what each employee would earn if the company's total pay were shared equally among everyone. In everyday conversation, the terms mean and average are often used interchangeably. However, this isn't technically accurate, as the mean is just one of the ways to calculate an average, as we'll explore later on. To calculate the mean, we simply add together all the salaries and divide the total by the number of employees. Let's look at the example company, PeopleTech Ltd. Imagine the five employees earn the following annual salaries: €30,000 + €40,000 + €40,000 + €50,000 + €100,000 = €260,000 PeopleTech Ltd. has a total annual salary bill of €260,000 across its five employees. To calculate the mean, we divide this total by five: €260,000 ÷ 5 = €52,000 So, the mean salary at PeopleTech Ltd. is €52,000. In other words, if the company's total salary bill were shared equally between all five employees, each person would receive €52,000. The mean is useful because it gives us an overall picture of pay across the company. However, as we'll see, it doesn't always reflect what most employees actually earn, particularly when there are significant differences between the highest and lowest salaries. The Median: What is the salary in the middle? But what happens when one or two employees earn significantly more than everyone else? This is where the median can give us a different perspective. While the mean looks at the total of all salaries, the median looks directly at the middle of the data. Imagine arranging all our employees in a straight line, from the lowest-paid to the highest-paid. The salary of the person standing in the middle would represent our median salary. Let's look at PeopleTech Ltd. again. Using the same salaries as before, we arrange them from lowest to highest: €30,000 | €40,000 | €40,000 | €50,000 | €100,000 The middle salary is €40,000, making this the median salary for PeopleTech Ltd. What makes the median particularly useful is that it is not affected by unusually high or low salaries, often referred to as outliers. In our example, let's assume the €100,000 salary belongs to the CEO, which is double the next highest salary. This unusually high salary pulls the mean upwards, making the average salary appear higher than what most employees actually earn. The median, however, is not affected by this unusually high salary. At €40,000, it gives us a different perspective on what a typical employee earns in PeopleTech Ltd. This is particularly useful for HR professionals because it helps us understand what employees typically earn, without the results being skewed by a small number of particularly high or low salaries. Neither figure is wrong. They simply tell us different things about how pay is distributed across the company. Looking at both together gives us a more complete picture than relying on either one alone. One thing to note: when there is an even number of employees, there won't be one person sitting exactly in the middle. In this case, we take the two middle salaries and calculate their average to find the median. How does this all relate to the EU Pay Transparency Directive? The EU Pay Transparency Directive requires employers to report on both the mean and median gender pay gap. These gaps are calculated by finding the average pay for male employees and the average pay for female employees, and then measuring the difference between them. The difference is expressed as a percentage of men's average pay. For example, a gender pay gap of +10% means that women's average pay is 10% lower than men's average pay. But why does the Directive want to look at both figures? The size of a company's mean gender pay gap and median gender pay gap can tell us different things about how pay is distributed across the organisation. If a company's mean gender pay gap is larger than its median gender pay gap, this could suggest that higher-paid employees are having a greater influence on the overall gap. Think back to our PeopleTech Ltd. example, where the CEO's €100,000 salary pulled the mean upwards. A similar effect could occur in an organisation where the pay gap between most male and female employees is relatively small, but a highly paid position, such as the CEO role, is occupied by a man. Even though the difference in pay across the wider workforce may be relatively modest, this one high salary could pull the mean upwards and result in a much larger overall gender pay gap. On the other hand, if a company's median gender pay gap is larger than its mean gender pay gap, this could suggest that the difference in pay is more evident across the wider workforce, rather than being driven primarily by a small number of highly or lower paid positions. In other words, the gap may be more noticeable among employees around the middle of the pay distribution, rather than being concentrated at the top. This could highlight wider differences in how men and women are paid across the organisation, and may warrant further investigation. It is important to remember that neither the mean nor the median tells us exactly why a gender pay gap exists. They are indicators that help us identify patterns and differences in pay, rather than explanations in themselves. By looking at both measures together, HR professionals can begin to build a clearer picture of pay within their organisation, identify areas that may need further investigation and take a more informed approach to understanding and addressing any gaps.

Read article

Michelle Dervan

2 Nov 2026

All About Averages | Pay Analytics 101

The Importance of the Average When talking about pay data, the term average appears time and time again, but what does it actually mean? Put simply, an average salary gives us one figure to help describe pay across a group of employees. It takes all the salary values from that group and calculates a figure that would represent a ‘typical’ employee in that group. This is useful because it allows us to compare pay between different employee groups without having to look at every individual salary. The average can become an even more powerful metric when we begin to understand and analyse the different ways it’s calculated. It might seem counterintuitive that a figure like the average can be calculated in different ways and possibly provide different answers. After all, how can the same set of salaries produce different averages? The key is that each method looks at the data differently, helping us bring a different part of the picture into focus. There are two types of average that are particularly important when it comes to understanding pay: the mean and the median. So, how do they work, and what can each tell us about pay? Let's introduce them using a simple example company, PeopleTech Ltd. The Mean: What would everyone earn if pay were shared equally? The mean is what many people think of when they hear the word average. It shows us what each employee would earn if the company's total pay were shared equally among everyone. In everyday conversation, the terms mean and average are often used interchangeably. However, this isn't technically accurate, as the mean is just one of the ways to calculate an average, as we'll explore later on. To calculate the mean, we simply add together all the salaries and divide the total by the number of employees. Let's look at the example company, PeopleTech Ltd. Imagine the five employees earn the following annual salaries: €30,000 + €40,000 + €40,000 + €50,000 + €100,000 = €260,000 PeopleTech Ltd. has a total annual salary bill of €260,000 across its five employees. To calculate the mean, we divide this total by five: €260,000 ÷ 5 = €52,000 So, the mean salary at PeopleTech Ltd. is €52,000. In other words, if the company's total salary bill were shared equally between all five employees, each person would receive €52,000. The mean is useful because it gives us an overall picture of pay across the company. However, as we'll see, it doesn't always reflect what most employees actually earn, particularly when there are significant differences between the highest and lowest salaries. The Median: What is the salary in the middle? But what happens when one or two employees earn significantly more than everyone else? This is where the median can give us a different perspective. While the mean looks at the total of all salaries, the median looks directly at the middle of the data. Imagine arranging all our employees in a straight line, from the lowest-paid to the highest-paid. The salary of the person standing in the middle would represent our median salary. Let's look at PeopleTech Ltd. again. Using the same salaries as before, we arrange them from lowest to highest: €30,000 | €40,000 | €40,000 | €50,000 | €100,000 The middle salary is €40,000, making this the median salary for PeopleTech Ltd. What makes the median particularly useful is that it is not affected by unusually high or low salaries, often referred to as outliers. In our example, let's assume the €100,000 salary belongs to the CEO, which is double the next highest salary. This unusually high salary pulls the mean upwards, making the average salary appear higher than what most employees actually earn. The median, however, is not affected by this unusually high salary. At €40,000, it gives us a different perspective on what a typical employee earns in PeopleTech Ltd. This is particularly useful for HR professionals because it helps us understand what employees typically earn, without the results being skewed by a small number of particularly high or low salaries. Neither figure is wrong. They simply tell us different things about how pay is distributed across the company. Looking at both together gives us a more complete picture than relying on either one alone. One thing to note: when there is an even number of employees, there won't be one person sitting exactly in the middle. In this case, we take the two middle salaries and calculate their average to find the median. How does this all relate to the EU Pay Transparency Directive? The EU Pay Transparency Directive requires employers to report on both the mean and median gender pay gap. These gaps are calculated by finding the average pay for male employees and the average pay for female employees, and then measuring the difference between them. The difference is expressed as a percentage of men's average pay. For example, a gender pay gap of +10% means that women's average pay is 10% lower than men's average pay. But why does the Directive want to look at both figures? The size of a company's mean gender pay gap and median gender pay gap can tell us different things about how pay is distributed across the organisation. If a company's mean gender pay gap is larger than its median gender pay gap, this could suggest that higher-paid employees are having a greater influence on the overall gap. Think back to our PeopleTech Ltd. example, where the CEO's €100,000 salary pulled the mean upwards. A similar effect could occur in an organisation where the pay gap between most male and female employees is relatively small, but a highly paid position, such as the CEO role, is occupied by a man. Even though the difference in pay across the wider workforce may be relatively modest, this one high salary could pull the mean upwards and result in a much larger overall gender pay gap. On the other hand, if a company's median gender pay gap is larger than its mean gender pay gap, this could suggest that the difference in pay is more evident across the wider workforce, rather than being driven primarily by a small number of highly or lower paid positions. In other words, the gap may be more noticeable among employees around the middle of the pay distribution, rather than being concentrated at the top. This could highlight wider differences in how men and women are paid across the organisation, and may warrant further investigation. It is important to remember that neither the mean nor the median tells us exactly why a gender pay gap exists. They are indicators that help us identify patterns and differences in pay, rather than explanations in themselves. By looking at both measures together, HR professionals can begin to build a clearer picture of pay within their organisation, identify areas that may need further investigation and take a more informed approach to understanding and addressing any gaps.

Read article

The information on this page is not intended to serve and does not serve as legal advice. All of the content, information, and material on this website are only for general informational use.

Copyright © 2026 SkillsTrust. All Rights Reserved.

The information on this page is not intended to serve and does not serve as legal advice. All of the content, information, and material on this website are only for general informational use.

Copyright © 2026 SkillsTrust. All Rights Reserved.

The information on this page is not intended to serve and does not serve as legal advice. All of the content, information, and material on this website are only for general informational use.

Copyright © 2026 SkillsTrust. All Rights Reserved.

The information on this page is not intended to serve and does not serve as legal advice. All of the content, information, and material on this website are only for general informational use.

Copyright © 2026 SkillsTrust. All Rights Reserved.